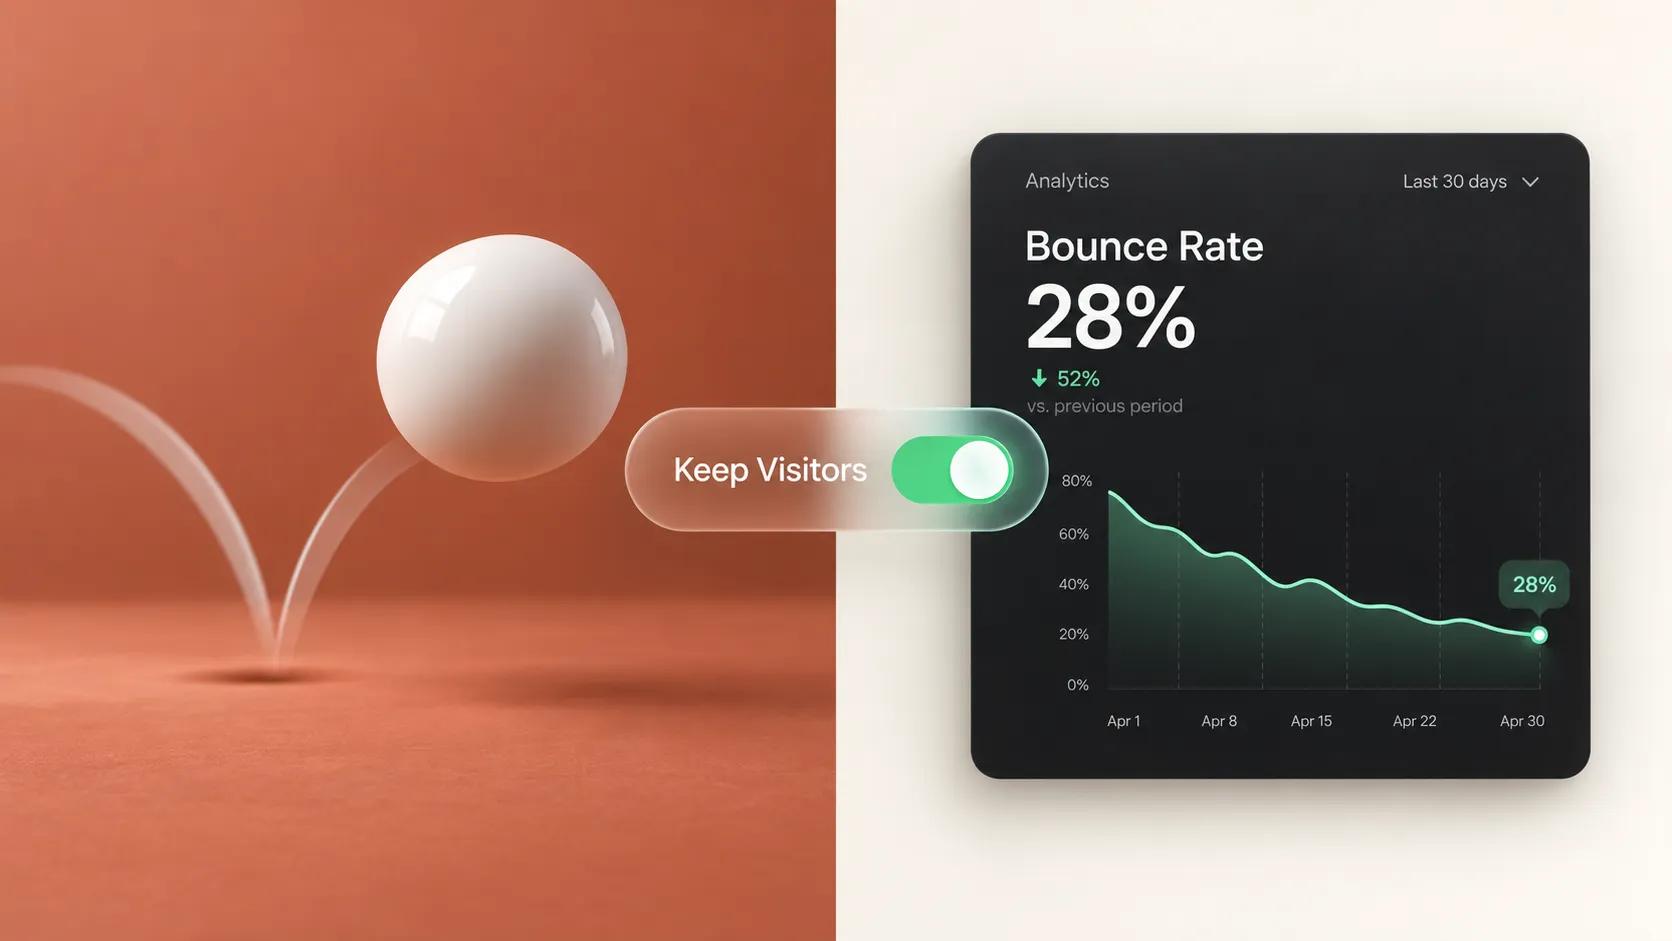

Every month, thousands of small business owners open their analytics dashboard, look at their primary traffic graphs, and immediately panic: "My bounce rate is hovering at 65%. Are thousands of potential customers hitting my site and walking away in disgust?"
Here is the plain truth: A high bounce rate does not automatically mean your website is failing. In fact, if a local client lands on your emergency plumbing page, finds your phone number in three seconds, and dials your office immediately, that session might log as a single-page visit—yet it resulted in a high-ticket paying customer!
Understanding what is a good website bounce rate shifts your focus away from misleading vanity percentages, helping you evaluate whether your pages are actually building your business or turning real buyers away.
Historically, dissecting bounce metrics meant wrestling with complex analytics setups and deciphering outdated tracking rules. Modern platforms have eliminated that technical barrier entirely. When you build your digital storefront on BoltWeb, structuring high-converting, engagement-ready architectures is built-in from day one. As an all-in-one business website builder, BoltWeb delivers rapid load speeds, clean mobile layouts, and native tag integrations—helping you launch search-optimized storefronts that turn raw traffic into daily customer revenue in under 60 seconds!
Here is your operational master blueprint on how to interpret your site's bounce rate, calculate good website bounce rate metrics across different industries, and optimize your pages for maximum profitability.
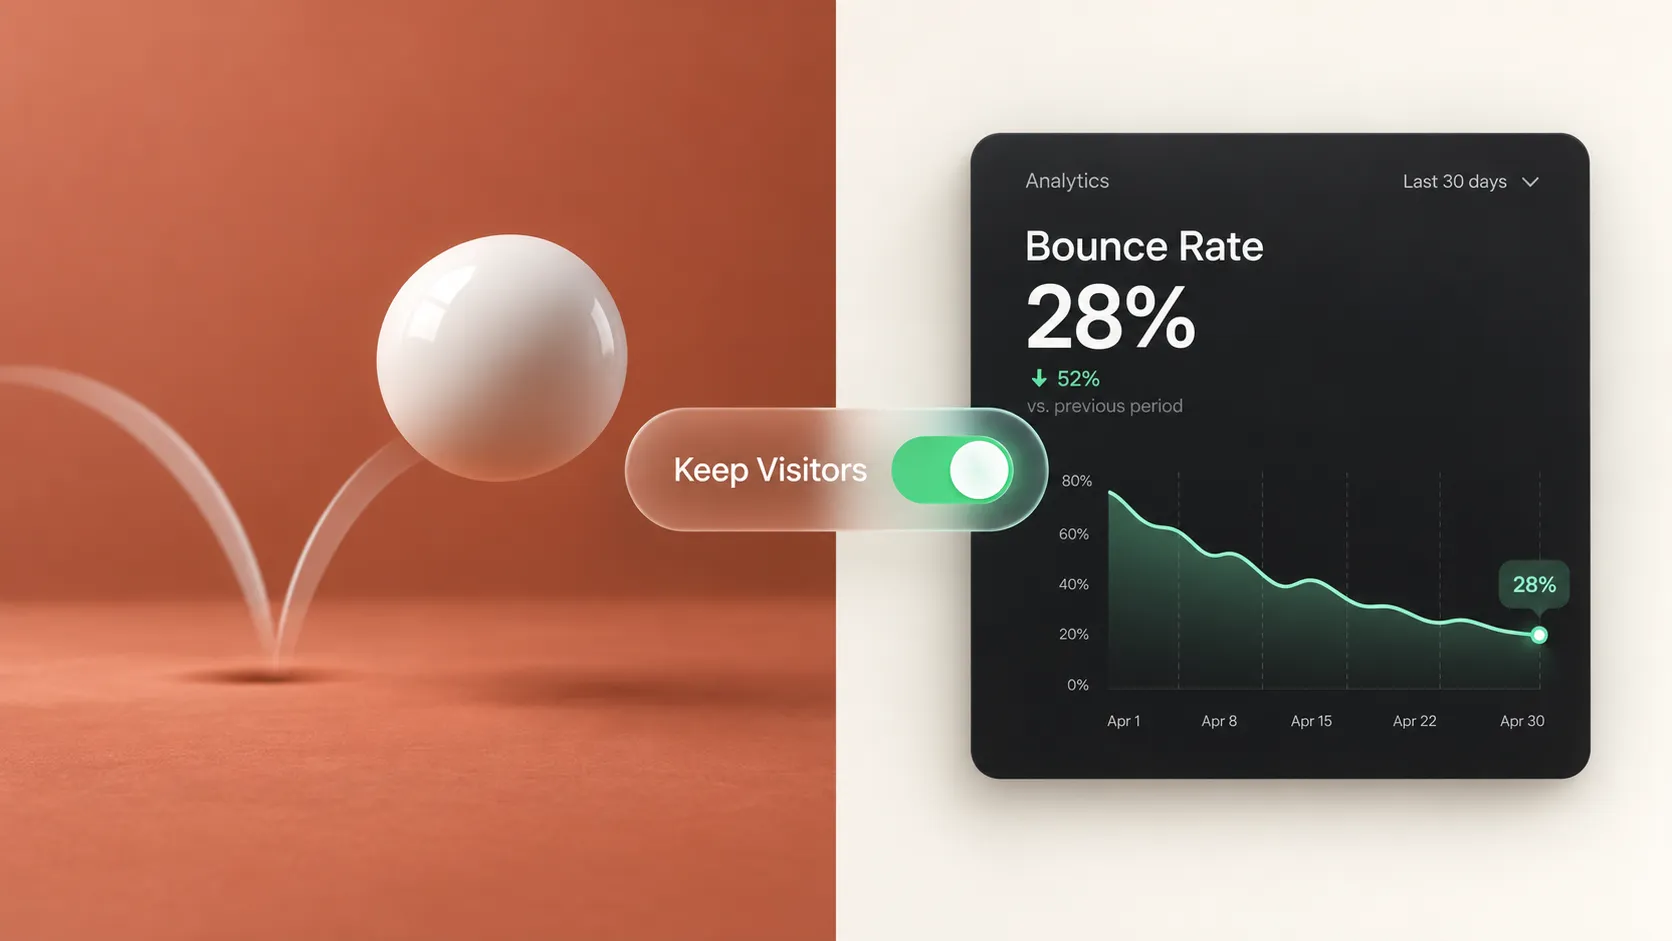
1. What Is a Good Website Bounce Rate? Start With Your Website's Goal
Let me clear up the biggest misconception in digital marketing right from the start: There is no universal, magic percentage that defines a "good" bounce rate. Whether a specific percentage represents success or failure depends entirely on the fundamental job of that specific web page:
| Page Intent & Purpose | Expected Bounce Rate Trajectory |
|---|---|
| Quick-Answer Contact Page | Naturally High (User finds phone/address) |
| In-Depth Product Comparison | Low to Moderate (User explores features) |
| Dedicated Lead Landing Page | Variable (Focuses strictly on 1 CTA) |
Evaluating what is a good website bounce rate starts with understanding your specific customer intent so you can target a good website bounce rate for your exact business model (start with the foundational Google Analytics setup walkthrough for small businesses).
2. What Does Bounce Rate Actually Measure?
If you are still judging your analytics using old marketing guides from five years ago, your interpretation of website bounces is likely completely wrong. In legacy analytics platforms, a "bounce" was recorded anytime a user viewed one page and closed the browser tab—regardless of whether they spent 10 seconds or 15 minutes reading your content.
In Google Analytics 4 (GA4), bounce rate has been completely redefined:
- Non-Engaged Session: A visit where the user stayed less than 10 seconds, completed zero key conversion events, and viewed only a single page.
- Engaged Session: A visit where the user spent 10+ seconds on page, triggered a key conversion event (form/call), or viewed 2+ pages.
Understanding what is bounce rate clarifies true website bounce rate dynamics and unlocks the real bounce rate meaning behind your user traffic reports.
3. What Is a Good Bounce Rate for Different Types of Websites?
Comparing a service company's contact page to an e-commerce catalog or a news blog is like comparing apples to bowling balls. Review how average bounce expectations shift across different website models:
| Website Type | Standard Bounce Rate Range |
|---|---|
| E-Commerce & Retail Stores | 25% – 45% (High internal navigation) |
| B2B Service & Corporate Sites | 30% – 55% (Focused solution seeking) |
| Lead Generation Landing Pages | 40% – 60% (Single action target) |
| Content Blogs & News Outlets | 65% – 90% (Single article consumption) |
Checking a realistic website bounce rate benchmark puts your average website bounce rate into context when comparing your website bounce rate by industry.
4. Why There Is No Perfect Bounce Rate Percentage
Fixating on an arbitrary sitewide target (like demanding a sub-30% bounce rate across every URL) often leads to flawed design decisions. Seven variables that naturally influence your bounce metrics:
- Traffic Acquisition Source: Organic search visitors seeking specific answers bounce less than cold social media ad traffic.
- Device Hardware: Mobile users reading on smartphones display higher natural bounce rates than desktop users on dual monitors.
- Search Query Intent: Informational search terms ("how to fix a leaky pipe") yield higher single-page exits than transactional searches ("emergency plumber near me").
- Content Format: Concise reference tables answer user queries faster than 3,000-word guides.
Evaluating a good website bounce rate alongside your overall average website bounce rate protects you from chasing an artificial bounce rate benchmark (also see tracing the real origins of your website visitors).
5. How to Calculate Bounce Rate in Google Analytics 4
"How does GA4 calculate my bounce rate?"
Google Analytics 4 calculates your bounce rate by measuring non-engaged sessions as a percentage of your overall traffic volume. Use the official GA4 calculation formula:
Or simply subtract your engagement rate from 100%:
Practical Numerical Example: A small business website receives 1,000 total sessions during a monthly reporting period. Of those 1,000 visits, 680 meet the criteria for an engaged session:
- Total Sessions: 1,000
- Engaged Sessions: 680
- Non-Engaged Sessions: 1,000 − 680 = 320
Mastering this bounce rate formula gives you a clear method to calculate bounce rate and audit your bounce rate in GA4 accurately (combine with analyzing website traffic reports).

6. Bounce Rate vs. Engagement Rate: What's the Difference?
Bounce rate and engagement rate are two sides of the exact same financial coin inside GA4.
- Engagement Rate: Measures the percentage of visitors who actively engaged with your content.
- Bounce Rate: Measures the remaining percentage of visitors who exited without engaging.
An engaged session is logged whenever a visitor satisfies at least one of these three conditions:
- Spends 10 seconds or more active on your page.
- Triggers a key conversion event (form submission, phone call click, purchase).
- Views 2 or more distinct pages during their visit.
Comparing bounce rate vs engagement rate clarifies your website engagement rate and helps interpret your GA4 engagement rate correctly (also see understanding what counts as a healthy engagement rate).
7. Where to Find Your Bounce Rate in Google Analytics 4
By default, GA4 hides the bounce rate column in standard exploration tables, requiring a quick 30-second report customization. Follow these direct steps to display bounce rate in your dashboard:
- Log into your GA4 property and navigate to Reports → Engagement → Pages and screens.
- Click the pencil icon (Customize report) in the top right corner.
- Click Metrics, select Add metric, and type Bounce rate.
- Drag Bounce rate next to Engagement rate, click Apply, and save changes to your report.
Review additional setup details inside official resources like the Google Analytics: Reports and acquisition analysis documentation and the Google Analytics: Landing page report guide.
Learning how to find bounce rate in GA4 unlocks your Google Analytics bounce rate report to analyze GA4 bounce rate metrics cleanly.
8. Why Your Website Bounce Rate Might Be High
When a high-traffic page displays an unusually high bounce rate paired with zero lead conversions, your site suffers from an operational friction point. Eight primary causes of high bounce rates:
- Mismatched Search Intent: Your search snippet promised one answer, but your page headline delivered vague marketing copy.
- Slow Page Loading Speed: Mobile readers hit the back button before your layout finishes rendering.
- Confusing Visual Hierarchy: Massive walls of unformatted text overwhelm users instantly.
- Intrusive Pop-Up Banners: Aggressive overlays block mobile readers from viewing your main offer.
- Unclear Hero Messaging: Visitors cannot tell who you are or what you sell within 5 seconds.
- Broken Mobile Navigation: Tiny buttons make tapping impossible on smartphone screens.
- Irrelevant Traffic Acquisition: Paid ad campaigns attracting non-targeted window shoppers (see finding where website traffic comes from).
- Missing Internal Linking: Your content lacks inline links guiding readers to logical next steps (see internal linking strategy for small business SEO).
Diagnosing a high website bounce rate isolates the underlying reasons for high bounce rate to solve critical website bounce rate problems (also see why visitors leave your website without acting).

9. Which Website Pages Should Have a High or Low Bounce Rate?
Treating every page on your site with the exact same bounce expectation causes unnecessary redesigns. Evaluate expected bounce rates across page categories:
| Page Category | Ideal Bounce Expectations | Primary Customer Objective |
|---|---|---|
| Homepage | Low (20% – 40%) | Acts as a central directory guiding users to services or products. |
| Core Service Pages | Low to Moderate (30% – 50%) | Educates prospects and encourages quote form submissions. |
| E-Commerce Checkout | Very Low (10% – 25%) | A high bounce here signals severe checkout friction. |
| Standalone Landing Pages | Moderate to High (40% – 60%) | Focuses strictly on a single call-to-action event. |
| Blog Articles & Guides | High (65% – 85%) | Answers a specific informational query directly. |
| Contact Us Page | High (60% – 80%) | Delivers instant phone numbers, addresses, or hours. |
Evaluating your landing page bounce rate, blog bounce rate, and ecommerce bounce rate ensures you judge overall website page bounce rate metrics correctly.
10. How to Reduce Website Bounce Rate Without Hurting User Experience
Warning: Do not try to lower your bounce rate by hiding answers behind multiple clicks or using deceptive pop-ups. Forcing unnecessary navigation frustrates users and destroys trust. Eight proven UX optimization fixes:
- Tighten Headline Alignment: Match your H1 title directly to the search terms bringing users to your page (see finding keywords in Google Search Console).
- Optimize Above-the-Fold Content: State your core value proposition clearly within the top screen fold.
- Improve Mobile Page Speed: Compress images and streamline CSS layout rendering.
- Use High-Contrast Action Buttons: Replace subtle links with eye-catching action buttons (see landing page CTA best practices).
- Embed Contextual Internal Links: Guide readers to related service guides within your body copy.
- Add Visual Proof Badges: Feature authentic client reviews, star ratings, and industry credentials near action buttons (see building trust on a business website).
- Streamline Input Forms: Reduce contact fields down to 3 essential inputs (see tracking contact form submissions in GA4).
- Fix Mobile Touch Targets: Ensure buttons and links scale cleanly for mobile thumb taps.
Learning how to reduce website bounce rate gives you a clear strategy to improve website bounce rate and lower bounce rate across your sales pages (also see how to make a website mobile-friendly).
11. Measure Bounce Rate Alongside Conversions and Business Results
Here is the ultimate test of web analytics: A page with a 60% bounce rate that converts 10% of total visitors into high-ticket phone inquiries is infinitely more valuable than a page with a 15% bounce rate that yields zero sales leads!
| High Bounce / High Revenue | Low Bounce / Zero Revenue (Failure) |
|---|---|
| 60% Bounce Rate | 15% Bounce Rate |
| 10% Lead Conversion Rate | 0% Lead Conversion Rate |
| $25,000 Generated Income | $0 Generated Income |
Correlating bounce rate and conversions aligns your website conversion rate with true website performance metrics (see tracking website sales and revenue and how to calculate website ROI).
12. Build a Monthly Bounce Rate Review for Your Website
Checking your metrics daily leads to overreacting to normal, temporary traffic fluctuations. Establishing a consistent 15-minute monthly review keeps your strategy grounded in solid data. Your 15-minute monthly review workflow:
- Step 1: Audit Top 5 Landing Pages: Compare month-over-month engagement rates on your highest-traffic pages (see identifying your best performing website pages).
- Step 2: Compare Device Performance: Check if mobile bounce rates run significantly higher than desktop rates.
- Step 3: Cross-Reference Key Events: Confirm that lower bounce rates correspond to higher contact form completions and call link taps (see tracking phone call conversions from your website).
- Step 4: Audit Organic Visibility: Review search queries inside the official Google Search Console: Performance report to spot intent mismatches.
Learning how to monitor bounce rate establishes a reliable website bounce rate analysis workflow to track website performance on BoltWeb (combine with the core metrics every small business should monitor).
Maximize Customer Engagement With BoltWeb
Analyzing bounce rates, optimizing page layouts, and engineering high-converting sales funnels shouldn't require complex coding or expensive web development retainers. When you launch your digital storefront on BoltWeb, every page is built for lightning-fast speeds, responsive mobile rendering, and high conversion right out of the box.
Whether you run a local contracting company, a professional consulting agency, or a growing online shop, BoltWeb designs search-optimized section layouts, integrates analytics tracking seamlessly, formats responsive mobile headers, and deploys high-converting pages tailored to your target audience.
Frequently Asked Questions: What Is a Good Website Bounce Rate?
1. My website's bounce rate is sitting at 62%—am I losing customers, or is this completely normal?
Here is the plain truth: A 62% bounce rate doesn't mean your business is failing. If a local homeowner lands on your emergency plumbing page, finds your phone number in four seconds, and calls your office, Google Analytics logs a single-page exit—yet you just landed a high-ticket client! Generally, a good website bounce rate for commercial service sites sits between 30% and 55%, while e-commerce stores aim for 25% to 45%. However, what counts as a solid result depends entirely on the specific job of that page. Judging your storefront against a realistic good website bounce rate metric helps you separate healthy customer actions from actual lost sales. When you build on BoltWeb, capturing engagement is automated from day one. As an all-in-one business website builder, BoltWeb delivers rapid load speeds, clean mobile structures, and native analytics tags—helping you deploy search-optimized layouts that convert visitors into active leads in under 60 seconds!
2. What does bounce rate actually measure inside Google Analytics 4?
If you are still reading old marketing blogs, your understanding of bounce rate is likely completely outdated. In Google Analytics 4, bounce rate is no longer calculated by whether someone leaves after one page. Instead, it measures the exact percentage of non-engaged sessions:
A session is counted as engaged if the visitor stays for 10 seconds or longer, views 2 or more pages, or triggers a key conversion event (such as submitting a form or tapping a phone link). Understanding what defines a website bounce rate demystifies what is bounce rate under the hood, allowing you to interpret the true bounce rate meaning behind your traffic reports.
3. Why should my service business website expect a different bounce rate than a blog or news site?
Comparing a local contractor or advisory firm's website to an online publication is like comparing a physical repair shop to a public library. Review how natural expectations shift across different website models: E-Commerce & Retail Stores (25% – 45% Target): Shoppers naturally navigate through multiple product pages and checkout steps. B2B & Local Service Sites (30% – 55% Target): Prospects arrive seeking specific solutions, pricing, or immediate contact options. Lead Generation Landing Pages (40% – 60% Target): Pages focus on a single action trigger without unnecessary extra clicks. Blogs & News Outlets (65% – 90% Target): Readers land on a single article, read the answer, and exit satisfied. Evaluating a website bounce rate benchmark against your specific industry puts your average website bounce rate into context based on your actual website bounce rate by industry.
4. Why is there no single 'magic percentage' for a good bounce rate?
Relying on a single target across every page on your domain leads to counterproductive design decisions. Seven core variables shape your unique baseline: Traffic Channel Intent: Organic search visitors seeking specific answers bounce less than cold social media ad traffic. Device Hardware: Smartphone users browsing on mobile networks display higher natural exit rates than desktop users on dual monitors. Query Specificity: Transactional search terms ("hire electrician near me") yield faster conversions than broad research queries. Layout Clarity: Clear pricing tables allow users to take action without clicking through multiple subpages. Evaluating a good website bounce rate alongside your average website bounce rate protects you from chasing an artificial bounce rate benchmark.
5. What is the exact formula to calculate bounce rate in Google Analytics 4?
Google Analytics 4 calculates your bounce rate by dividing non-engaged sessions by total sessions over any selected timeframe. Use the official GA4 calculation formula:
Practical Numerical Example: If your site receives 1,000 total visits and 680 of them are logged as engaged sessions (stayed over 10 seconds, viewed 2+ pages, or submitted a form): Total Sessions: 1,000 / Engaged Sessions: 680 / Non-Engaged Sessions: 1,000 − 680 = 320
Mastering this bounce rate formula gives you a clear method to calculate bounce rate and audit your bounce rate in GA4 accurately.
6. How are Bounce Rate and Engagement Rate related in my reporting dashboard?
In GA4, bounce rate and engagement rate are exact mathematical inverses of one another.
If your traffic report displays an engagement rate of 70%, your bounce rate is automatically 30%. Comparing bounce rate vs engagement rate clarifies the operational balance between website engagement rate and GA4 engagement rate so you can read your metrics with complete confidence.
7. Where do I click inside Google Analytics 4 to find my bounce rate reports?
By default, GA4 hides the bounce rate column in standard exploration tables, requiring a quick 30-second report customization. Follow these direct steps: Log into your GA4 property and navigate to Reports → Engagement → Pages and screens. Click the pencil icon (Customize report) in the top right corner. Select Metrics, click Add metric, and choose Bounce rate. Apply changes and save the report to your dashboard. Review additional setup details inside official resources like the Google Analytics: Reports and acquisition analysis documentation and the Google Analytics: Landing page report guide. Knowing how to find bounce rate in GA4 unlocks your Google Analytics bounce rate report to analyze GA4 bounce rate metrics across all your active pages.
8. Why are visitors backing out of my pages without exploring my services?
When a high-traffic page displays an unusually high bounce rate paired with zero lead conversions, your storefront is experiencing visual, technical, or psychological friction. Eight primary causes of high bounce rates: Mismatched Search Intent: Your search snippet promised a quick fix, but your headline delivered vague corporate marketing filler. Slow Page Load Speed: Mobile readers hit the back button before your main layout finishes rendering. Intrusive Pop-Ups: Aggressive newsletter overlays block readers from viewing your main offer. Unclear Calls to Action: Primary buttons blend into the background instead of standing out clearly (see landing page CTA best practices). Confusing Hero Layout: Visitors cannot determine who you are or what you offer within the first 5 seconds. Broken Mobile Navigation: Small buttons make tapping frustrating on phone screens. Irrelevant Ad Traffic: Paid ad campaigns attracting non-targeted users (see finding where website traffic comes from). Missing Internal Links: Body copy lacks contextual links leading to related service pages (see internal linking strategy for small business SEO). Diagnosing a high website bounce rate isolates the underlying reasons for high bounce rate to solve critical website bounce rate problems. Building on BoltWeb eliminates layout friction automatically, delivering pre-optimized visual structures that keep readers engaged!
9. Should every single page on my website aim for a low bounce rate?
No! Forcing every page to target the exact same low bounce rate will lead to flawed design choices. Each page category performs a different job in your customer journey: Homepage: Requires a low bounce rate (20% – 40%) to guide users into specific service channels. Core Service Pages: Requires low to moderate bounce rates (30% – 50%) to educate prospects and capture lead forms. E-Commerce Checkout: Requires a very low bounce rate (10% – 25%), as high exits here mean lost sales. Blog Articles & Reference Guides: Naturally experience higher bounce rates (65% – 85%) because readers land to answer one specific question. Contact & Directions Pages: Naturally exhibit higher bounce rates (60% – 80%) because prospects grab your phone number or address in seconds and exit completely satisfied! Evaluating your landing page bounce rate, blog bounce rate, and ecommerce bounce rate ensures you judge overall website page bounce rate metrics appropriately.
10. How can I lower my bounce rate without annoying visitors or using tricky pop-ups?
Never try to lower your bounce rate by hiding answers behind extra clicks or splitting content across unnecessary subpages. Artificial barriers frustrate buyers and ruin business trust. Eight high-leverage optimization tactics: Align Headlines with Search Intent: Match your H1 title directly to the search queries driving organic traffic (see finding keywords in Google Search Console). Optimize Above-the-Fold Messaging: State your core value proposition clearly within the top screen view. Improve Mobile Page Speed: Compress images and streamline CSS layout rendering. Use High-Contrast Action Buttons: Make your lead buttons visually unmistakable. Insert Contextual Internal Links: Guide readers to related services directly within your body copy. Embed Authentic Visual Proof: Feature client reviews, star ratings, and trust badges near action buttons (see building trust on a business website). Streamline Contact Forms: Cut required input fields down to 3 basic items (see tracking contact form submissions in GA4). Fix Mobile Touch Targets: Ensure links and buttons scale cleanly for mobile thumb taps. Learning how to reduce website bounce rate gives you a clear strategy to improve website bounce rate and lower bounce rate across your core pages.
11. Can a page have a high bounce rate and still generate higher revenue for my business?
Yes, absolutely! Revenue and bounce rate do not always move in a straight line. Consider two real-world page scenarios: Page A: 20% Bounce Rate | 1,000 Visitors | 0 Completed Phone Calls = $0 Revenue. Page B: 60% Bounce Rate | 1,000 Visitors | 40 Completed Phone Calls = $15,000 Revenue. Page B has a higher technical bounce rate, but its direct layout converts high-intent buyers into paying clients immediately. Always prioritize cleared bank deposits over cosmetic analytics percentages. Correlating bounce rate and conversions aligns your website conversion rate with true website performance metrics (see tracking website sales and revenue and how to calculate website ROI).
12. How often should I review my bounce rate metrics so I don't overreact to daily fluctuations?
Checking your bounce rate every day leads to overreacting to normal, minor day-to-day traffic swings. Set up a structured 15-minute monthly review: Step 1: Audit Top 5 Entry Pages: Compare month-over-month engagement trends on your highest-traffic pages (see identifying your best performing website pages). Step 2: Inspect Channel Breakdown: Check whether paid ads, social media, or organic search channels show bounce increases. Step 3: Compare Mobile vs. Desktop: Verify if smartphone users display higher bounce rates than desktop visitors. Step 4: Cross-Reference Conversions: Confirm that lower bounce rates correspond to higher contact form completions and call link taps (see tracking phone call conversions from your website). Step 5: Audit Search Intent: Review impression patterns inside the official Google Search Console: Performance report to catch query mismatches early. Establishing a routine to monitor bounce rate creates a reliable website bounce rate analysis workflow to track website performance on BoltWeb (also see the core metrics every small business should monitor).