Every single number on your web analytics dashboard tells a direct story about your revenue potential. When you log into your analytics property, you are greeted by graphs, session totals, and user counts. But if you only check your total page views and log out, you are ignoring the critical commercial indicators that dictate whether your site is growing your company or wasting your resources.
Here is the plain truth: Traffic volume alone does not pay your bills. A storefront receiving 50,000 monthly visitors that yields zero phone inquiries or lead forms is far less valuable than a targeted landing page bringing in 200 visitors and 20 high-ticket client contracts. Understanding which core website metrics to monitor shifts your focus away from empty vanity numbers and exposes the exact variables driving business growth.
Historically, analyzing website performance meant wrestling with complex spreadsheets and deciphering obscure technical terminology. Modern platforms have completely changed that dynamic. When you build your online storefront with BoltWeb, monitoring key performance indicators is fully integrated from day one. As an all-in-one business website builder, BoltWeb features clean system architecture, native tag routing, and conversion-ready layouts—allowing you to launch a data-backed, search-optimized storefront in under 60 seconds!
Here is your operational guide on measuring website metrics for small business success, identifying high-converting channels, and turning analytics reports into daily revenue.
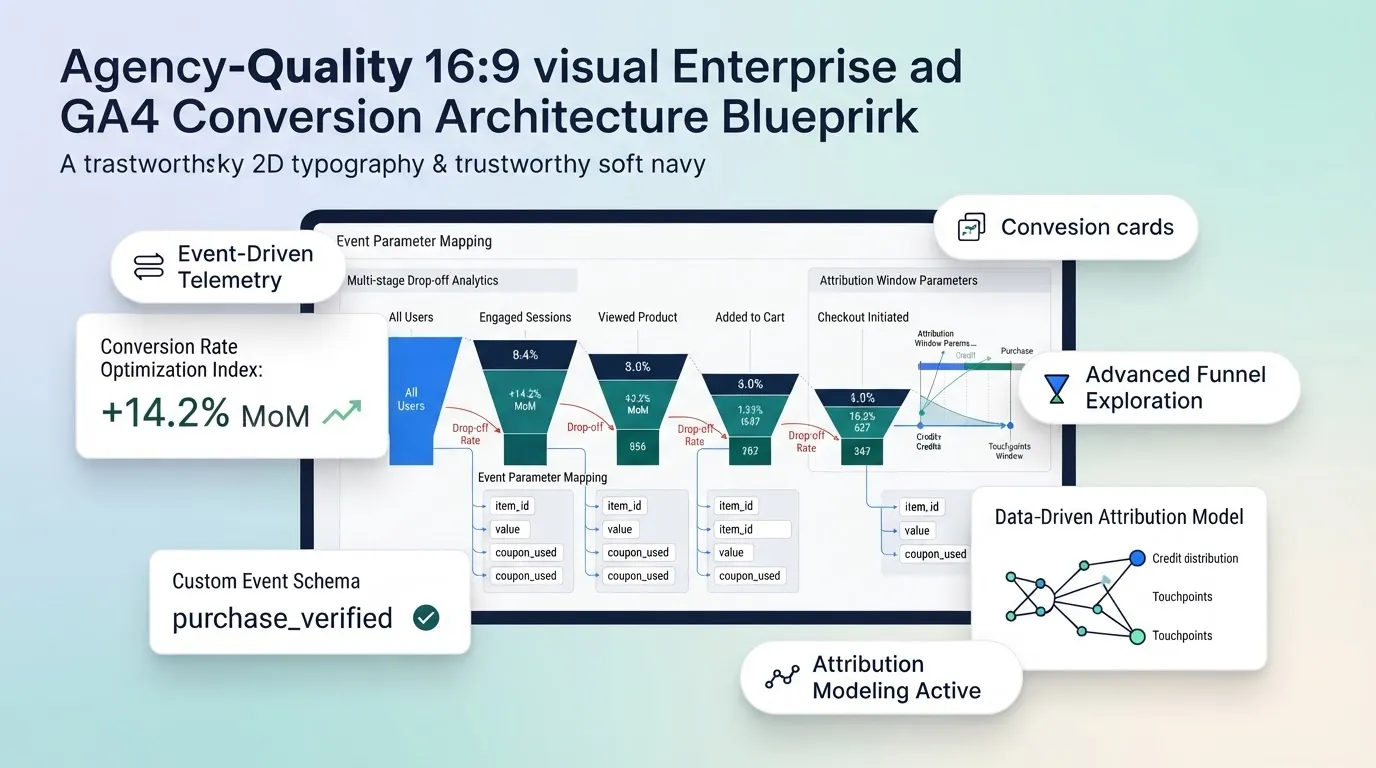
1. Which Website Numbers Actually Matter to a Small Business?
Let's clear up the confusion surrounding analytics metrics right from the start: Not all data points carry equal weight. You must separate basic activity metrics from critical outcome metrics. Activity metrics (like total raw page loads) show that something happened on your server. Outcome metrics (like completed quote requests or purchases) prove that your site generated commercial value:
| Activity Metrics (Vanity) | Outcome Metrics (Commercial Value) |
|---|---|
| Total Pageviews | Completed Lead Form Submissions |
| Generic Session Volume | Click-to-Call Phone Inquiries |
| Raw Social Media Clicks | Completed Online Sales & Order Value |
Defining core website metrics allows you to prioritize actionable website metrics for small business growth without getting lost in complicated reports (start with the foundational Google Analytics setup walkthrough for small businesses).
2. Website Traffic: Are the Right People Finding You?
Seeing your traffic graphs trend upward feels great, but bringing non-targeted visitors to your site will not grow your sales. When auditing incoming visitors, evaluate traffic quality across distinct channels:
- Organic Search Traffic: Unpaid visitors searching for solutions on Google or Bing.
- Direct Traffic: High-intent users typing your exact domain or clicking a bookmark.
- Referral Traffic: Users arriving via external recommendations or backlink mentions.
- Paid Campaign Traffic: Prospects arriving directly from targeted ad campaigns.
Tracking key website traffic metrics clarifies your website traffic sources and improves your overall website analytics strategy (combine with finding where website traffic comes from and analyzing website traffic reports).
3. Engagement: What Do Visitors Do After They Arrive?
Attracting a visitor to click your link is worthless if they hit the back button within 3 seconds because your content failed to match their intent. Evaluating real audience resonance requires inspecting key website engagement metrics:
- Engagement Rate: The percentage of sessions where a visitor spent at least 10 seconds on page, viewed 2 or more pages, or triggered a conversion event.
- Engaged Sessions: The actual number of high-intent visits logged during a reporting period.
- Average Engagement Time: The active time prospects spend reading your copy on screen.
Monitoring your engagement rate provides a deep website user behavior analysis to reveal content issues before they hurt sales (see related strategies in understanding what counts as a good engagement rate).
4. Landing Page Performance: Which Pages Bring Visitors Closer to Action?
Your landing pages serve as your digital front doors. When a potential customer arrives from a search query or an ad, that page must establish immediate trust and present a clear next step. To evaluate initial entry performance, cross-reference session data with the official Google Analytics: Landing page report documentation. Key steps to audit landing pages:
- Identify top entrance URLs by total user volume.
- Compare the key event completion rates across pages receiving similar traffic.
- Rewrite weak headers or replace low-contrast buttons on underperforming pages (see landing page CTA best practices).
Evaluating landing page metrics helps you analyze page performance metrics using reliable website page analytics (extend with identifying your best performing website pages).
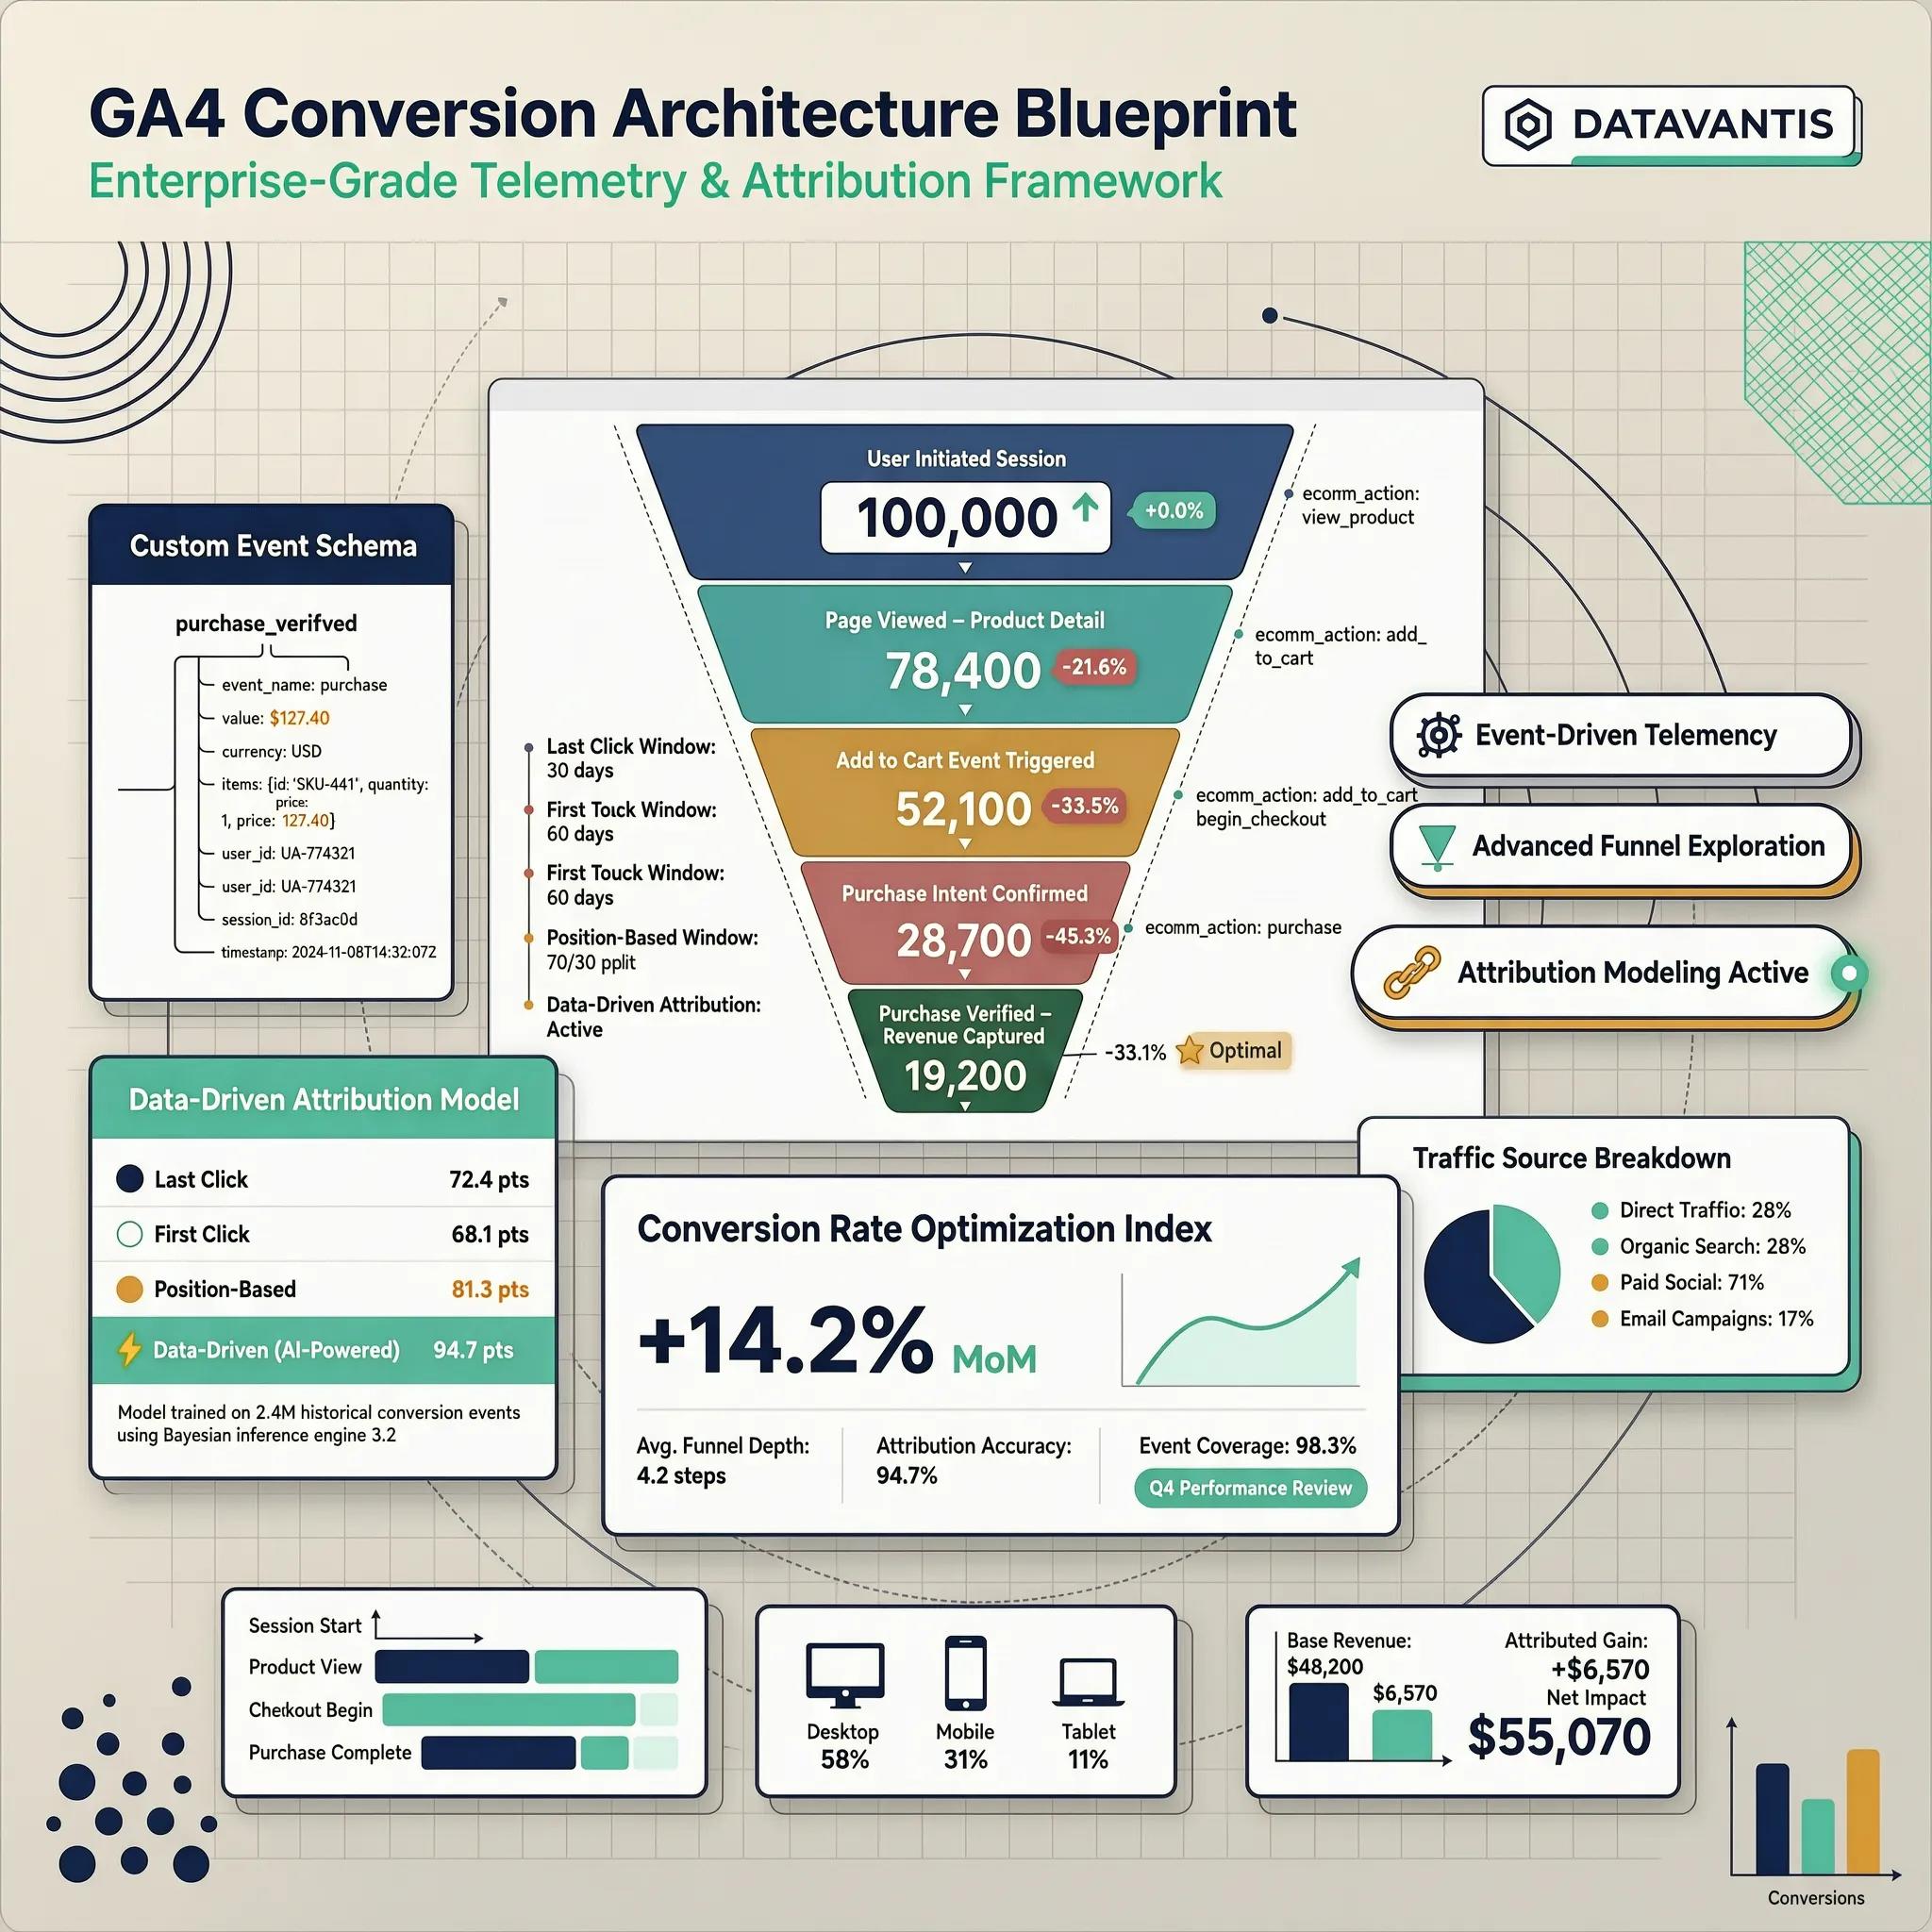
5. Conversion Rate: How Many Visitors Become Leads or Customers?
This is the ultimate efficiency metric for every online storefront. Your conversion rate measures the exact percentage of total visitors who take a predefined business action. Calculate your site's conversion efficiency using this formula:
Target Benchmarks: While average rates vary by industry, a high-performing landing page typically converts between 3% and 8% of total visitors into qualified leads.
Tracking your website conversion rate establishes clear website conversion metrics and defines reliable website KPIs across all your campaigns (deepen the analysis in our complete guide to tracking website conversions with GA4).
6. Lead Generation: Are Contact Forms and Calls Producing Enquiries?
For service providers, consultants, and local contractors, lead generation forms and phone links represent your primary digital revenue stream. Measure completed lead actions cleanly across all contact points:
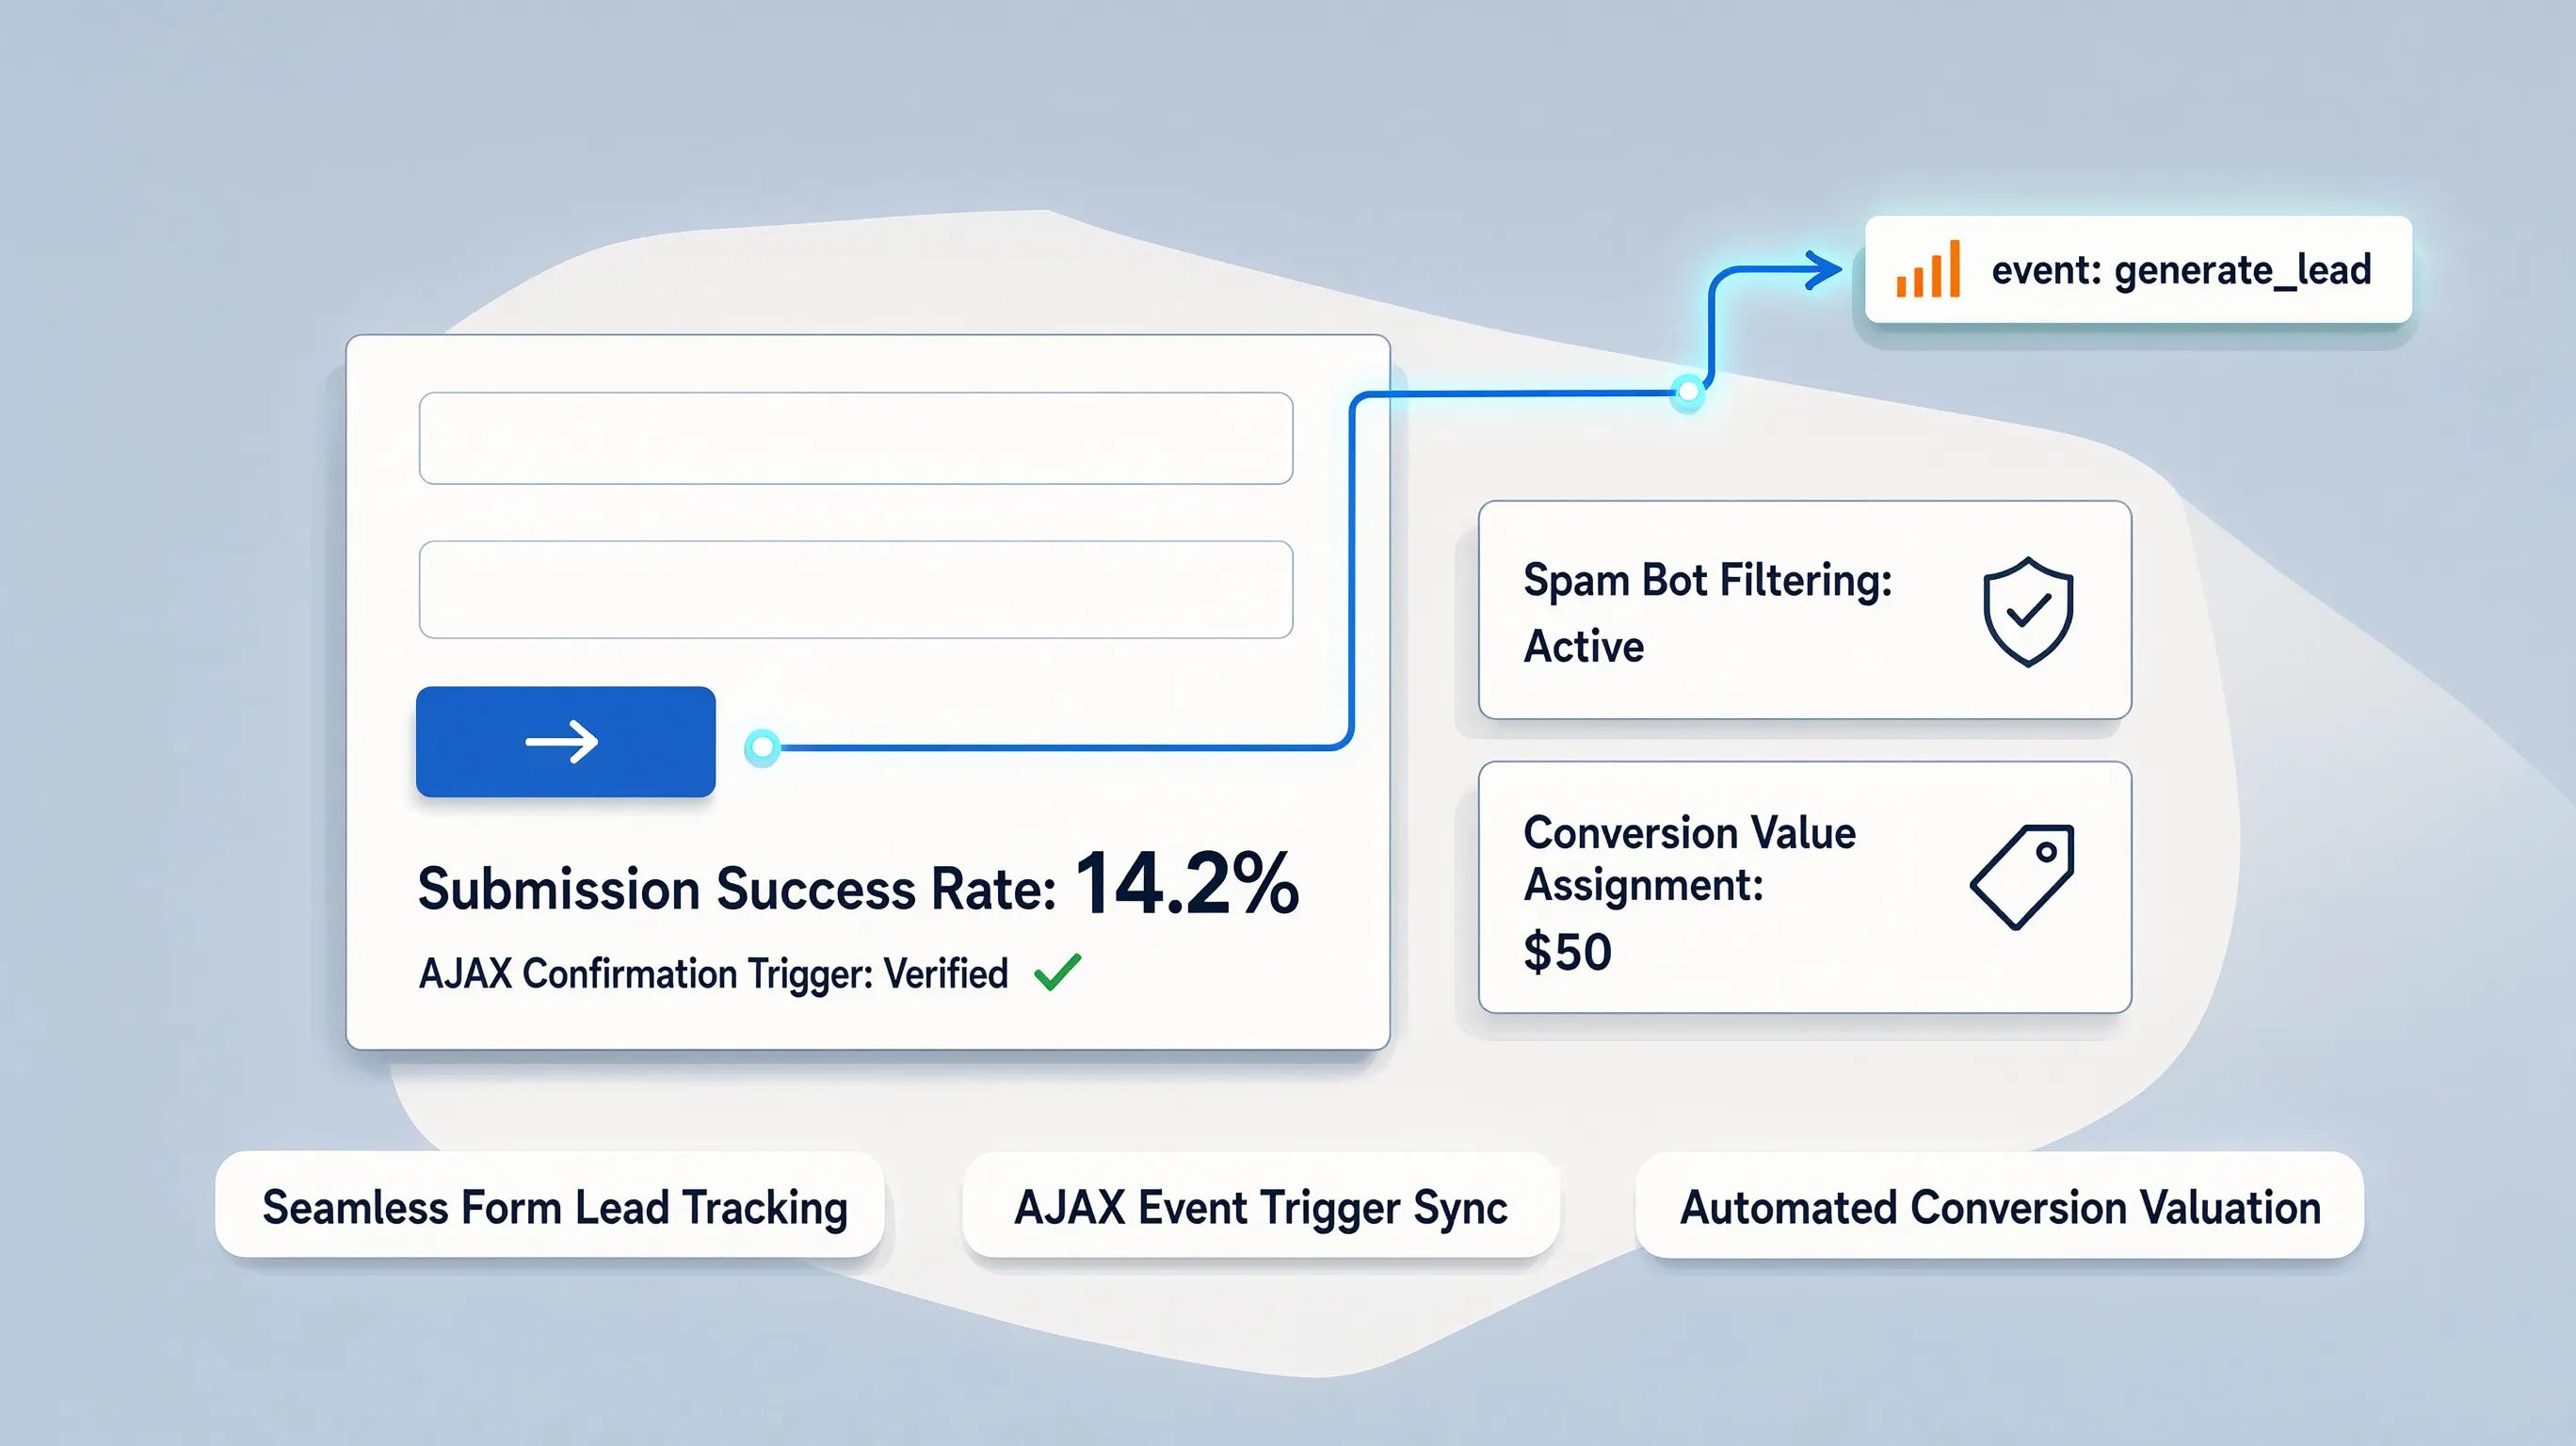
- Contact Form Submissions: Measure completed form entries using thank-you pages or form-success listeners (see tracking contact form submissions in GA4).
- Click-to-Call Phone Inquiries: Capture mobile visitors dialing your office line directly (see tracking phone call conversions from your website).
- Appointment Scheduling: Track completed online calendar bookings (explore how to add a booking form to a website).
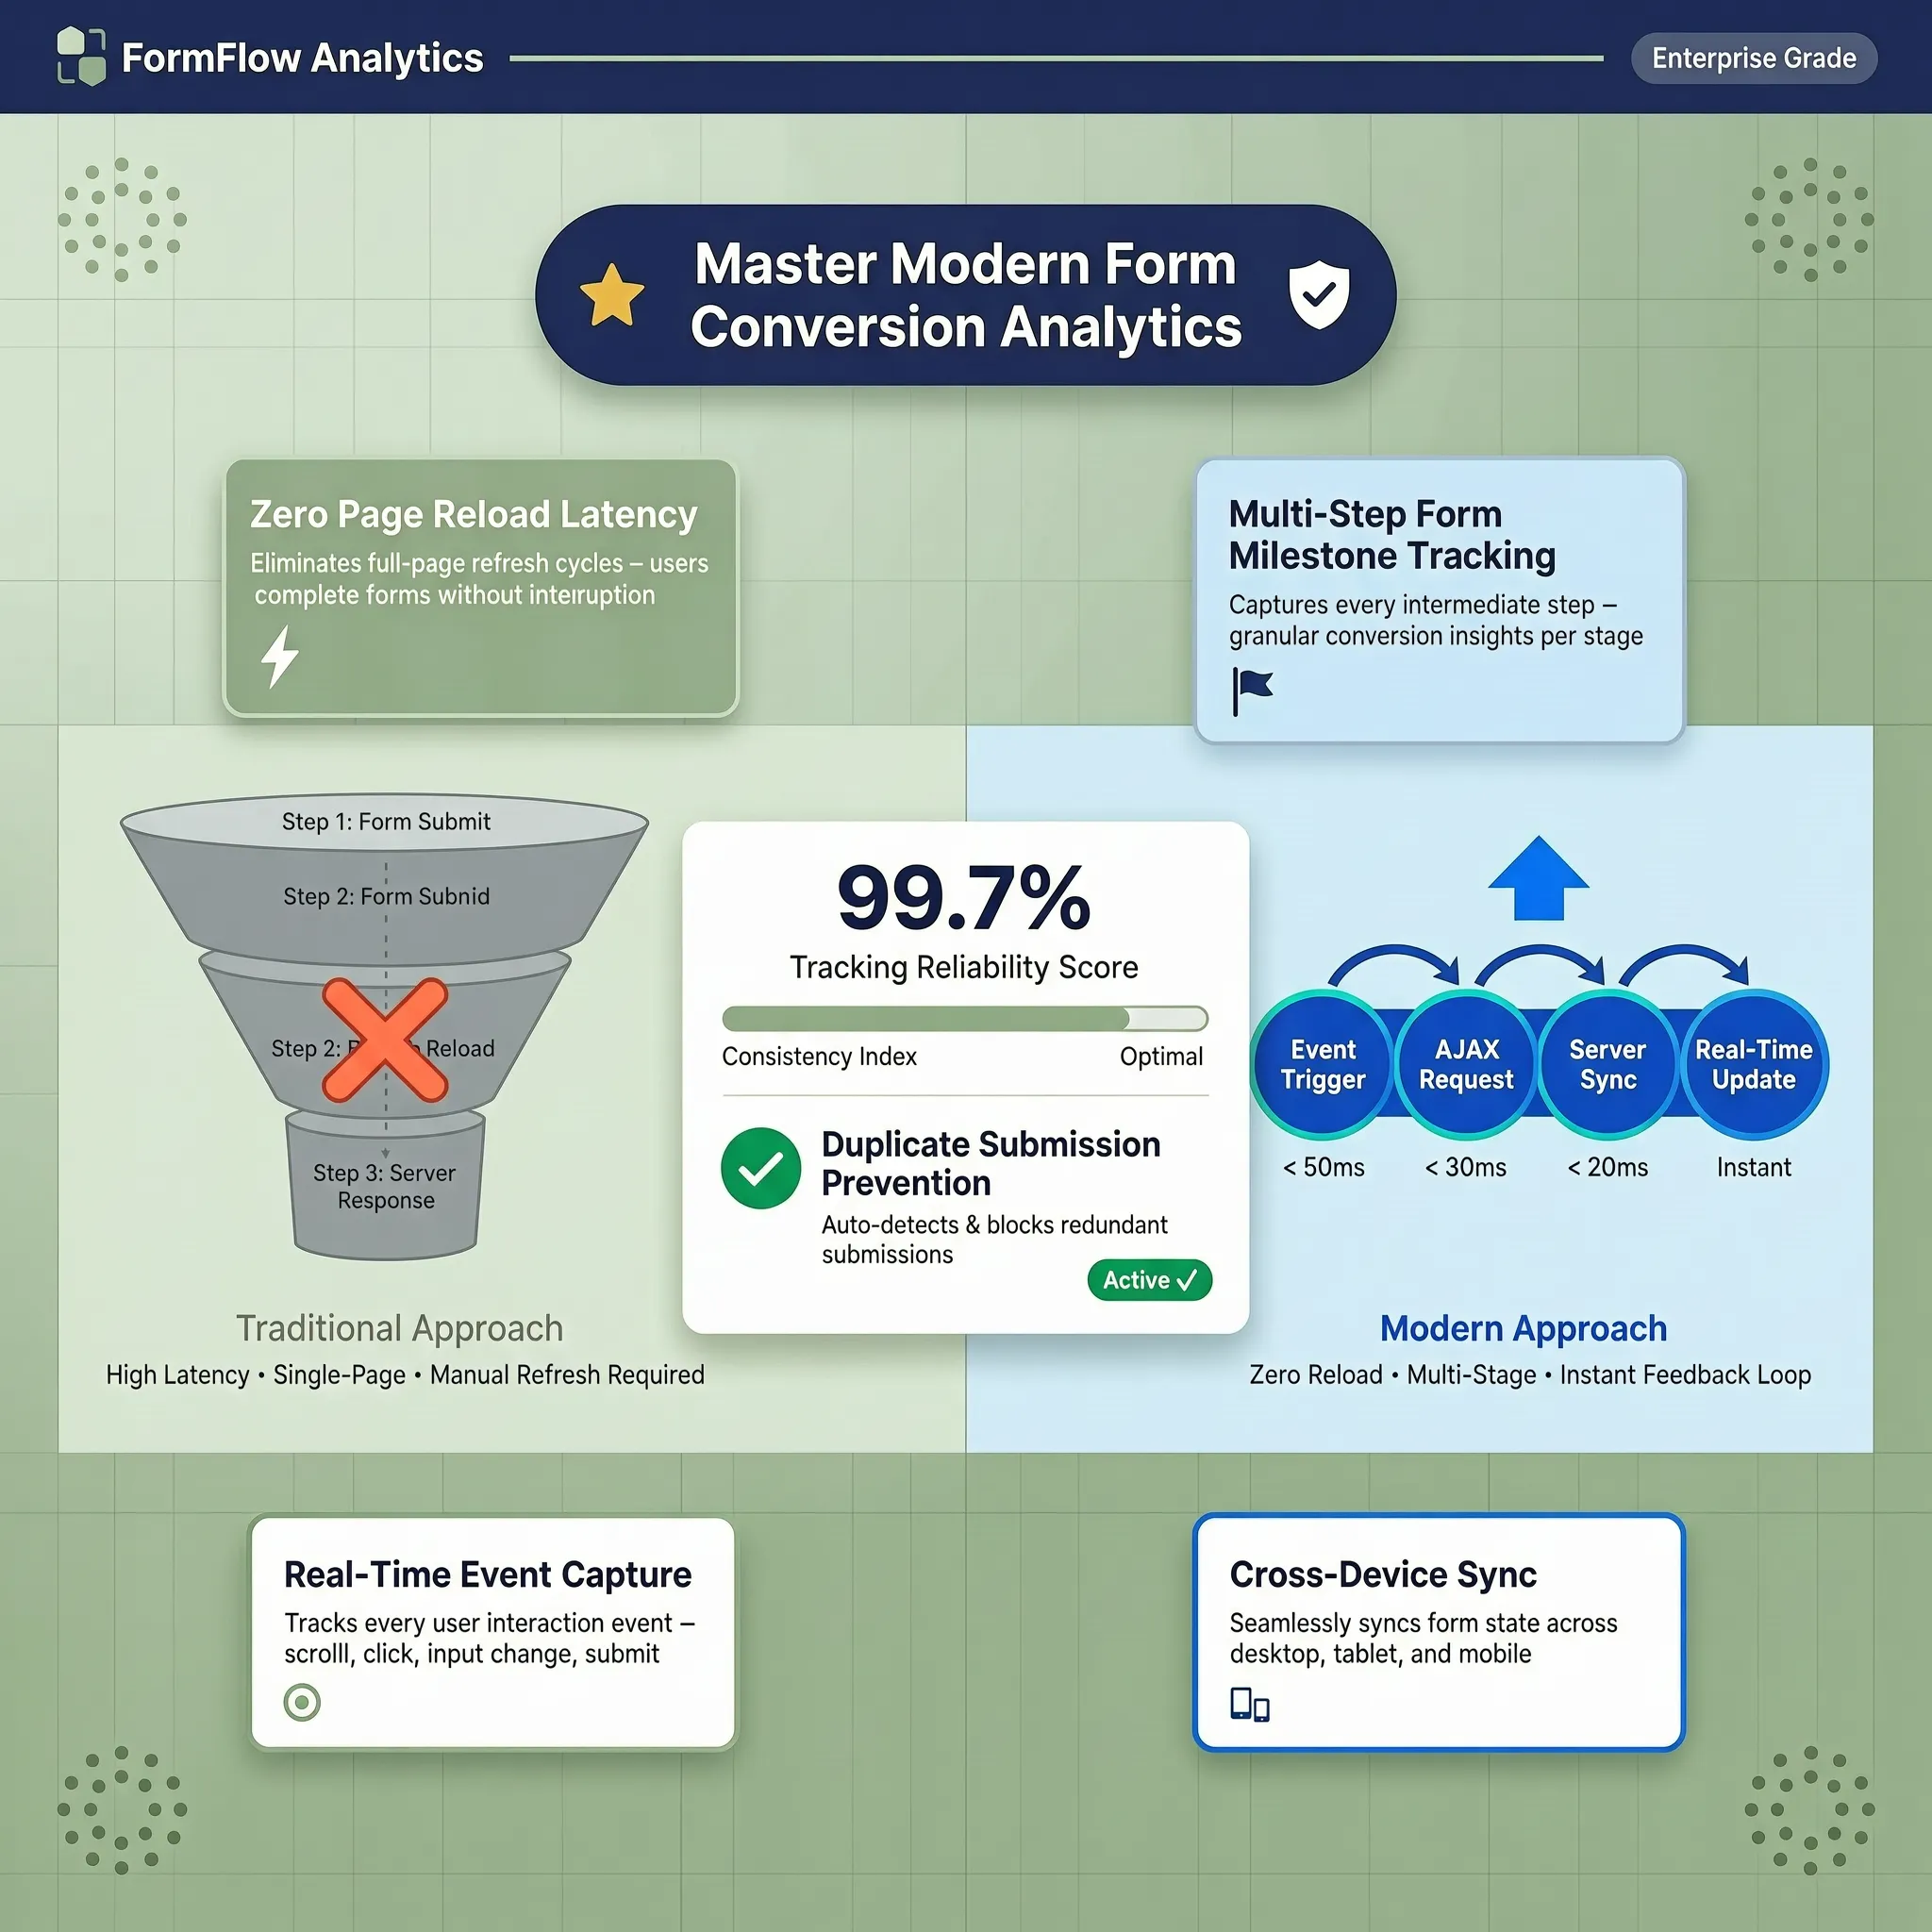
Tracking website lead generation metrics measures your contact form conversion rate and shows you how to track phone call conversions accurately.
7. Sales and Revenue: What Is Your Website Contributing?
If you operate an e-commerce store or process transactions online, connecting analytics directly to dollar amounts is essential. Track financial metrics inside your reporting property:
| Financial Metric | Operational Insight Output |
|---|---|
| Gross Revenue | Total monetary value generated online |
| Average Order Value (AOV) | Average dollar amount spent per checkout |
| E-Commerce Conversion Rate | Percentage of sessions making a purchase |
Reviewing website revenue metrics clarifies overall ecommerce metrics to measure true website sales performance (see details in tracking website sales and revenue).
8. Search Visibility: Are People Finding You on Google?
Evaluating how potential customers discover your storefront on Google requires looking beyond on-site analytics to inspect search engine diagnostic reports. Review the official Google Search Console: Performance report to analyze four vital organic search indicators:
- Impressions: How often your page snippet appears in Google search results.
- Clicks: The number of times searchers selected your link.
- Average CTR: The percentage of impressions that generated a click.
- Average Position: Your average ranking placement for target queries (learn more in finding keywords in Google Search Console).
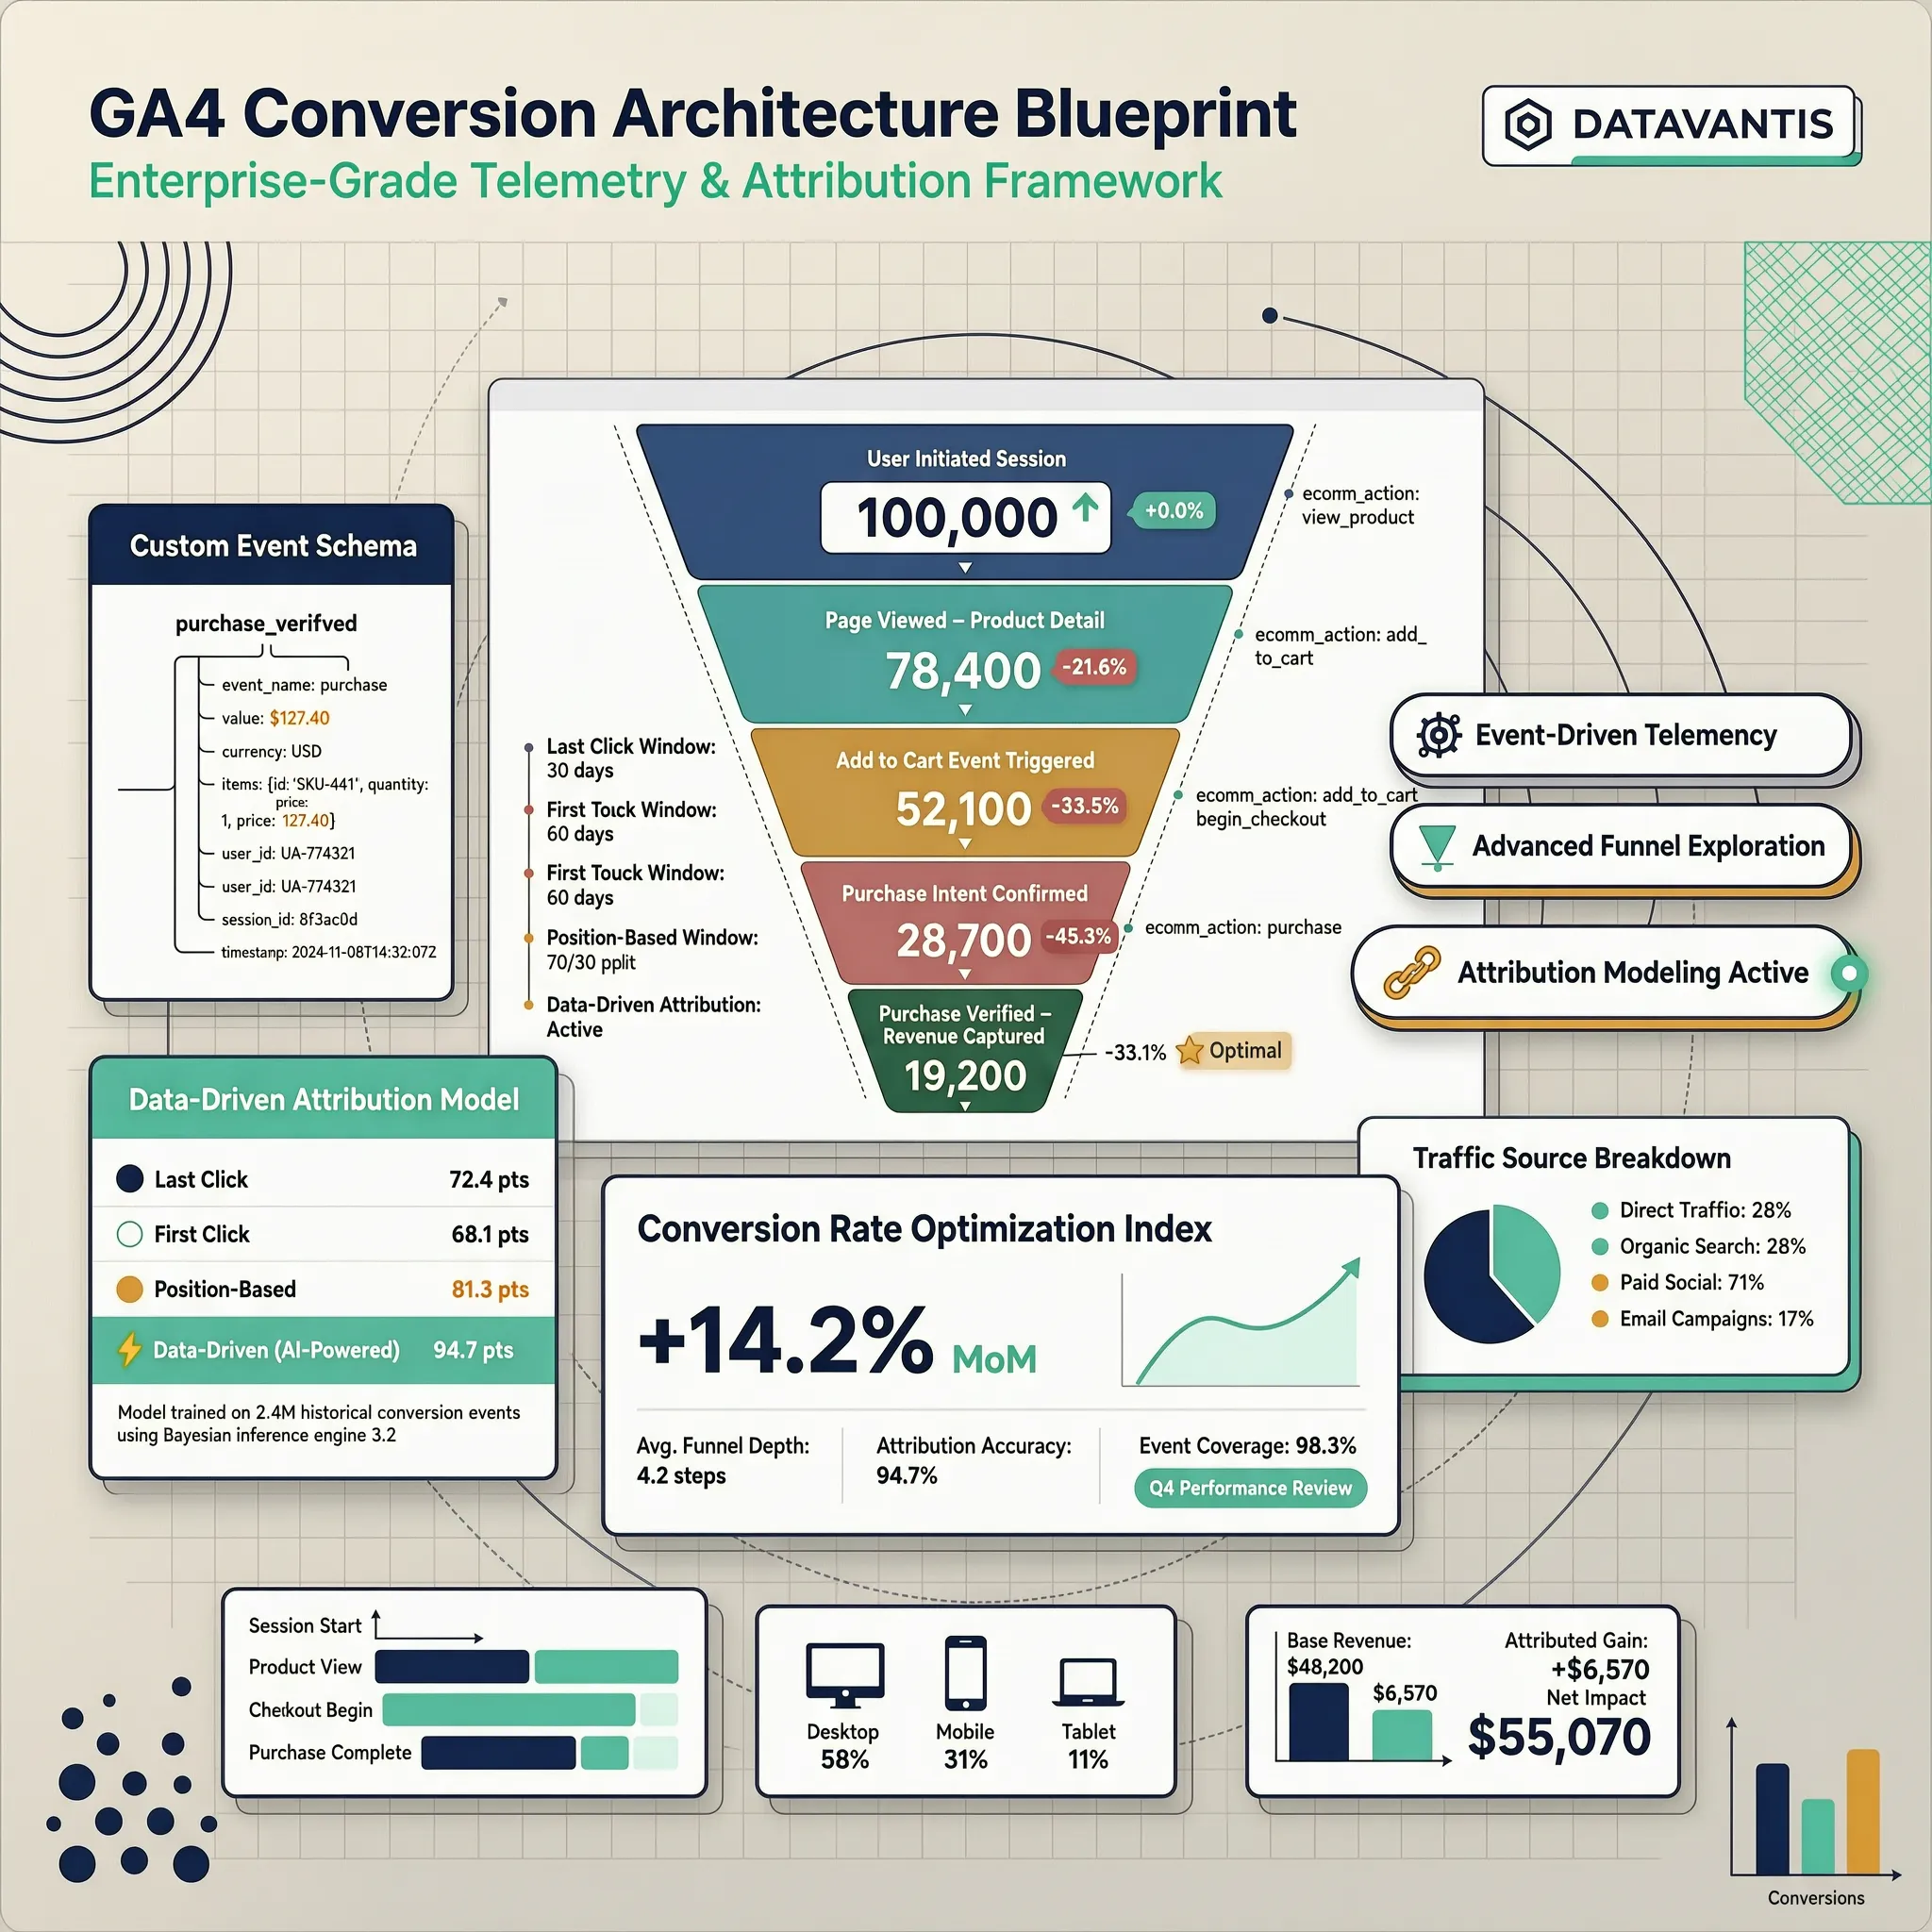
Tracking website SEO metrics improves your organic traffic metrics using accurate Google Search Console metrics (pair with the Google Search Console guide for small businesses).
9. Website Speed and Mobile Performance: Are Technical Issues Costing You Visitors?
A slow, hard-to-navigate website ruins your conversion rates regardless of how compelling your sales copy is. Technical performance factors that directly impact user behavior:
- Page Load Speed: Slow loading times increase bounce rates on mobile devices.
- Core Web Vitals: Google's visual metrics that evaluate loading speed, visual stability, and interactive responsiveness.
- Mobile Usability: Ensuring buttons are easy to tap and text scales correctly on small screens.
Reviewing website performance metrics, fixing website speed metrics, and auditing mobile website performance protects your site from losing visitors (also see diagnosing why your website feels slow).
10. Returning Visitors: Do People Come Back to Your Website?
First-time visitors rarely buy on their very first session. A healthy business website encourages repeat visits to build long-term trust. Compare audience loyalty metrics:
- New Users: First-time visitors discovering your business.
- Returning Users: Prospective clients coming back to review pricing, read blog posts, or complete a lead form.
Analyzing returning visitors alongside overall website visitor metrics helps you understand how repeat visitors engage with your brand (also see how to build trust with your website).
11. How to Build a Simple Website Metrics Dashboard
"I don't want to spend hours checking dozens of reports."
Checking analytics dashboards daily can lead to decision fatigue. Establishing a streamlined, 6-metric business dashboard keeps your strategy focused on clear goals. Your core weekly performance dashboard:
- Total Unique Users: Overall reach and traffic volume.
- Traffic Acquisition Channels: Top sources driving new visitors (see finding where website traffic comes from).
- Engagement Rate: Audience dwell time and content resonance.
- Top Entry Landing Pages: Primary entrance points for new leads (see identifying your best performing website pages).
- Total Key Events (Conversions): Form inquiries, calls, and purchases generated.
- Overall Conversion Rate: Overall page conversion efficiency.
Building a streamlined website analytics dashboard gives you a clear website KPI dashboard to generate concise website metrics report summaries.
12. How Often Should You Check Website Metrics, and What Should You Do Next?
Reviewing data once is helpful, but establishing a monthly 15-minute optimization routine builds consistent business growth over time. Follow this 4-step monthly review sequence:
- Step 1: Spot the Trend: Compare month-over-month performance across your core metrics.
- Step 2: Isolate the Bottleneck: Identify pages that attract traffic but suffer from low engagement or zero conversions.
- Step 3: Make One Change: Update a headline, improve CTA button contrast, or add authentic customer proof (see building trust on your business website).
- Step 4: Measure Impact: Allow 30 days to collect data before making further adjustments.
Learning how to monitor website performance and track website metrics establishes a sustainable website analytics for small business strategy on BoltWeb (pair with fixing high-traffic pages that fail to convert).
Transform Your Website Analytics Into Daily Customer Revenue
Tracking key performance metrics, diagnosing conversion bottlenecks, and optimizing landing page layouts shouldn't feel like a frustrating technical chore. When you publish your digital storefront on BoltWeb, every performance tool is optimized for conversion from day one.
Whether you run a local contracting service, a boutique advisory firm, or an online storefront, BoltWeb builds search-optimized section layouts, integrates analytics tracking code seamlessly, formats responsive mobile headers, and deploys lead-generating pages tailored to your audience.
Frequently Asked Questions: Crucial Website Metrics for Business Owners
1. Why do small business owners need to track website metrics instead of just counting total visitors?
Here is the plain truth: Traffic volume alone won't pay your business bills—a storefront receiving 10,000 passive clicks a month that yields zero phone inquiries or lead forms is far less valuable than a targeted landing page bringing in 200 visitors and 20 paying client contracts. Counting raw pageviews tells you almost nothing about your commercial growth. Tracking targeted website metrics gives you absolute visibility into where your audience originates, which sales copy holds their attention, and which pages convert casual browsers into paying customers. When you publish your digital storefront on BoltWeb, monitoring your key performance indicators is completely integrated right out of the box. As an all-in-one business website builder, BoltWeb automatically pairs lead forms, booking widgets, and call buttons with clean event structures in under 60 seconds!
2. How do I know whether my website traffic is bringing in potential clients or random clicks?
Seeing your traffic graphs trend upward feels great, but bringing non-targeted visitors to your storefront will not grow your sales revenue. Auditing visitor quality requires inspecting entry paths across distinct acquisition channels: Organic Search Traffic: Unpaid searchers actively looking for your specific services on Google or Bing. Direct Traffic: High-intent prospects who type your exact web address or open a saved bookmark. Referral Traffic: Users arriving directly via external industry recommendations, partner links, or directory mentions. Paid Campaign Traffic: Targeted prospects arriving directly from active ad campaigns. Tracking core website traffic metrics clarifies your primary website traffic sources and elevates your overall website analytics strategy.
3. Why do people land on my pages and leave almost instantly without taking action?
Attracting a visitor to click your link is worthless if they hit the back button within 3 seconds because your content failed to match their intent. Evaluating real audience resonance requires measuring key website engagement metrics: Engagement Rate: The percentage of sessions where a visitor spent at least 10 seconds on page, viewed 2 or more pages, or triggered a key conversion event. Engaged Sessions: The actual number of high-intent visits logged during a reporting period. Average Engagement Time: The active time prospects spend reading your offer on screen. Monitoring your engagement rate provides deep website user behavior insights to fix content friction before it impacts your bottom line (also see understanding what counts as a healthy bounce rate).
4. Which landing pages are actually helping my business grow, and which ones need work?
Your landing pages serve as your digital front door. When a prospective customer arrives from a search engine query or a paid campaign, that page must establish immediate trust and present a clear path forward. To evaluate initial entry performance, cross-reference session counts with your primary lead data: Identify your top entrance URLs by total user volume. Compare the key event completion rates across pages receiving similar traffic. Replace weak headers or low-contrast call-to-action buttons on underperforming pages (see landing page CTA best practices). Evaluating landing page metrics helps you analyze page performance metrics using reliable website page analytics (combine with identifying your best performing website pages).
5. What is a good website conversion rate for a local service or small business site?
Your conversion rate is the ultimate efficiency metric for your digital storefront, measuring the exact percentage of total visitors who take a predefined commercial action. Calculate your site's conversion efficiency using this simple formula:
While average conversion rates vary by industry, a high-converting service landing page typically converts between 3% and 8% of total visitors into qualified sales inquiries. Tracking your website conversion rate establishes clear website conversion metrics and defines reliable website KPIs across all your campaigns (deepen the analysis in our complete guide to tracking website conversions with GA4).
6. How do I know if my contact forms and phone links are producing real inquiries?
For service providers, consultants, and local contractors, lead generation forms and click-to-call phone links represent your primary digital revenue stream. Measure completed lead actions cleanly across all contact points: Contact Form Submissions: Track completed form entries using thank-you pages or form-success listeners (see tracking contact form submissions in GA4). Click-to-Call Phone Inquiries: Capture mobile visitors dialing your office line directly (see tracking phone call conversions from your website). Appointment Scheduling: Track completed online calendar bookings (explore how to add a booking form to a website). Tracking website lead generation metrics measures your contact form conversion rate and shows you how to track phone call conversions accurately.
7. How can I measure the actual sales revenue generated by my website?
If you operate an e-commerce store or process transactions online, connecting your analytics dashboard directly to dollar amounts is essential. Track financial performance using three core metrics: Gross Revenue: The total monetary value generated from online checkouts. Average Order Value (AOV): The average dollar amount spent per transaction. E-Commerce Conversion Rate: The percentage of sessions that complete a paid purchase (see tracking website sales and revenue). Reviewing website revenue metrics clarifies overall ecommerce metrics to measure true website sales performance.
8. Why does my business rank on Google search results but get so few clicks?
Evaluating how potential customers discover your storefront on Google requires looking beyond on-site analytics to inspect search engine diagnostic reports. Review Google Search Console to analyze four vital organic search indicators: Impressions: How often your page snippet appears in Google search results. Clicks: The total number of times searchers selected your link. Average CTR (Click-Through Rate): The percentage of search impressions that generated a click. Average Position: Your average ranking placement for target search queries (learn more in finding keywords in Google Search Console). Tracking website SEO metrics improves your organic traffic metrics using accurate Google Search Console metrics (pair with the Google Search Console guide for small businesses).
9. Could a slow mobile website speed be driving away my potential customers?
A slow, clunky website ruins your conversion rates regardless of how compelling your sales copy or pricing offers are. Technical performance factors that directly impact user behavior include: Page Load Speed: Slow loading times trigger immediate bounce rates on mobile smartphones. Core Web Vitals: Visual performance indicators measuring loading speed, visual stability, and interactive responsiveness. Mobile Usability: Ensuring buttons are easy to tap and text scales seamlessly across screen sizes. Reviewing website performance metrics, fixing website speed metrics, and auditing mobile website performance protects your site from losing visitors (also see diagnosing why your website feels slow and how to make a website load faster).
10. Do visitors remember my business, or do they leave and never come back?
First-time visitors rarely buy on their initial session. A healthy business storefront relies on repeat visits to build long-term commercial trust. Compare audience loyalty across two distinct visitor types: New Users: First-time prospects discovering your services. Returning Users: Interested prospects coming back to review pricing, read case studies, or complete a lead form. Analyzing returning visitors alongside overall website visitor metrics helps you understand how repeat visitors engage with your brand over time (also see building a website that brings customers back).
11. How do I build a simple website metrics dashboard without spending hours checking reports?
Checking complex analytics dashboards daily can lead to decision fatigue. Establishing a streamlined 6-metric business dashboard keeps your strategy focused on clear goals. Your core weekly performance dashboard should track: Total Unique Users: Overall reach and traffic volume. Traffic Acquisition Channels: Top channels driving new visitors (see finding where website traffic comes from). Engagement Rate: Audience dwell time and content resonance. Top Entry Landing Pages: Primary entrance points for new leads (see identifying your best performing website pages). Total Key Events: Completed form inquiries, call taps, and sales transactions. Overall Conversion Rate: Overall page conversion efficiency. Building a streamlined website analytics dashboard gives you a clear website KPI dashboard to generate concise website metrics report summaries.
12. How often should I check my website numbers, and what should I fix first?
Checking your metrics daily leads to unnecessary guesswork over normal fluctuations. Setting up a monthly diagnostic routine gives you clear data to make strategic upgrades. Follow this 4-step monthly review sequence: Identify Trends: Look at month-over-month shifts across your core numbers to see if traffic and leads are growing. Pinpoint Drop-Offs: Find high-traffic service pages where visitors bounce without completing a form. Execute One Upgrade: Refresh your headline, improve button visibility, or embed social proof (see building trust on your business website). Evaluate Results: Give your changes 30 days to collect data before testing another element. Taking time to monitor website performance and routinely track website metrics provides a solid website analytics for small business framework when launching on BoltWeb (also see fixing high-traffic pages with low conversion rates).