Every website traffic report holds a hidden story about your business growth. When you open your analytics dashboard, you are greeted by graphs, user counts, and session metrics. But if you only glance at the total visitor count and close the tab, you are missing out on the critical commercial insights hidden beneath the surface.
Here is the plain truth: Raw traffic numbers do not pay your bills. A traffic report that shows 50,000 monthly page views but yields zero qualified sales leads is far less valuable than a report showing 500 targeted visitors that generate 50 high-ticket client bookings. Learning how to read and analyze website traffic reports transforms raw numerical data into clear, actionable business strategies.
Historically, analyzing website analytics required hours of sorting through complex data tables and deciphering technical jargon. Modern platforms have completely changed that dynamic. When you build your digital presence with BoltWeb, monitoring visitor behavior is completely integrated right from day one. As an all-in-one business website builder, BoltWeb features clean system architecture, automatic tag routing, and conversion-ready layouts—allowing you to launch a data-backed, search-optimized storefront in under 60 seconds!
Here is your master operational guide on how to analyze website traffic reports, diagnose visitor behavior, and turn website analytics into daily business revenue.
1. What Can a Website Traffic Report Actually Tell You?
Let's clear up the mystery around web analytics reports right from the start: A traffic report is not just a passive scorecard. It is a live diagnostic tool that reveals how real human beings find, navigate, and respond to your digital storefront. When you open a modern analytics dashboard, your data is grouped into five primary operational pillars:
| Report Metric Pillar | Core Business Insights Revealed |
|---|---|
| Audience Volume (Users) | Total reach and brand awareness size |
| Acquisition Channel | Which marketing campaigns drive visits |
| Landing Page Entrances | Your most effective digital front doors |
| Engagement Duration | How well your content holds attention |
| Key Event Conversions | Direct revenue and lead generation |
Learning how to analyze website traffic gives you complete clarity across all your website traffic reports, shifting your strategy from guesswork to accurate data (start with the foundational Google Analytics setup walkthrough for small businesses).
2. Start With the Traffic Trend: Is Your Website Growing or Losing Visitors?
Here is a common mistake business owners make: celebrating a single daily traffic spike or panicking over a temporary weekend dip. Isolated daily metrics create unnecessary noise. To uncover real business growth, evaluate macro trends over consistent time periods:
- Compare Month-Over-Month (MoM): Evaluate baseline momentum and short-term marketing campaign impact.
- Compare Year-Over-Year (YoY): Account for natural industry seasonality, holiday shifts, and annual buying cycles.
Running a structured website traffic analysis allows you to spot true website traffic trends and analyze website visitors with absolute confidence (also see how to diagnose a sudden drop in website traffic).
3. Find Out Where Your Website Visitors Come From
Acquiring website visitors is meaningless if you don't know which marketing channels are delivering them to your door. Your traffic report breaks down visitor entry paths into core Default Channel Groups:
- Organic Search: Unpaid visitors arriving from Google or Bing search queries.
- Direct: Visitors who type your exact domain name or open a saved bookmark.
- Referral: Traffic clicking hyperlinked text from external websites or directories.
- Organic Social: Unpaid visits coming from profile bios or social posts.
- Paid Search / Paid Social: Targeted prospects arriving directly from active ad campaigns.
Reviewing your website traffic sources through a detailed traffic source analysis clarifies your overall website acquisition report (learn more in finding where website traffic comes from).
4. Compare Traffic Sources: Which Ones Bring Valuable Visitors?
"Should I focus on the channel that sends the most visitors?"
Here is the plain truth: The marketing channel that sends the highest volume of visitors is not automatically your most profitable asset. A high-volume traffic channel that brings 10,000 passive clicks but zero sales leads is a drain on your marketing budget. Compare channel performance across quality indicators:
| High-Volume / Low-Value | Low-Volume / High-Value (Winner) |
|---|---|
| 10,000 Social Media Visits | 400 Organic Search Visits |
| 12-Second Average Engagement | 2-Minute 45-Second Average Engagement |
| 0.1% Conversion Rate | 8.5% Conversion Rate |
| 10 Low-Quality Inquiries | 34 High-Ticket Client Contracts |
Learning how to compare website traffic sources reveals true traffic quality so you can optimize overall channel performance (combine with fixing high-traffic pages that fail to convert).
5. Identify the Pages Bringing Visitors Into Your Website
Your homepage is no longer the only entry point to your business. In modern search engine landscapes, inner service pages and blog posts frequently serve as your digital front door. To analyze your entry points:
- Open your reporting platform and navigate to your landing page performance metrics.
- Inspect the official Google Analytics: Landing page report documentation to see how entrances, users, and key event rates interact.
- Identify top-performing entry URLs and double down on their conversion elements (see identifying your best performing website pages).
Reviewing your website landing page report highlights core website page traffic patterns to help you optimize landing page traffic.
6. Investigate Pages That Get Traffic but Little Engagement
Discovering a page that draws thousands of visitors but fails to hold their attention represents your single biggest immediate growth opportunity. When visitors land on a page and leave almost instantly, investigate these primary friction points:
- Mismatched Search Headlines: The page content fails to deliver what the search result promised.
- Weak Visual Hierarchy: Wall-of-text formatting overpowers visitors before they read key points.
- Unclear Calls to Action: The page lacks a clear, high-contrast action button (see landing page CTA best practices).
Executing a thorough website engagement analysis isolates poor page engagement to streamline your visitor behavior analysis (also see why visitors leave your website without acting).
7. Trace the Visitor Journey: What Happens After the First Click?
Understanding user flow helps you optimize the exact visual paths that turn casual browsers into paying customers. Map key interaction steps along the customer journey:
Analyzing your website visitor journey uncovers true website user flow patterns to transform overall visitor behavior (pair with website navigation best practices).
8. Find Traffic That Turns Into Leads, Bookings, or Sales
Analyzing page views and dwell time is helpful, but connecting web traffic directly to revenue is what scales your company. Configure event tracking to measure core commercial outcomes:
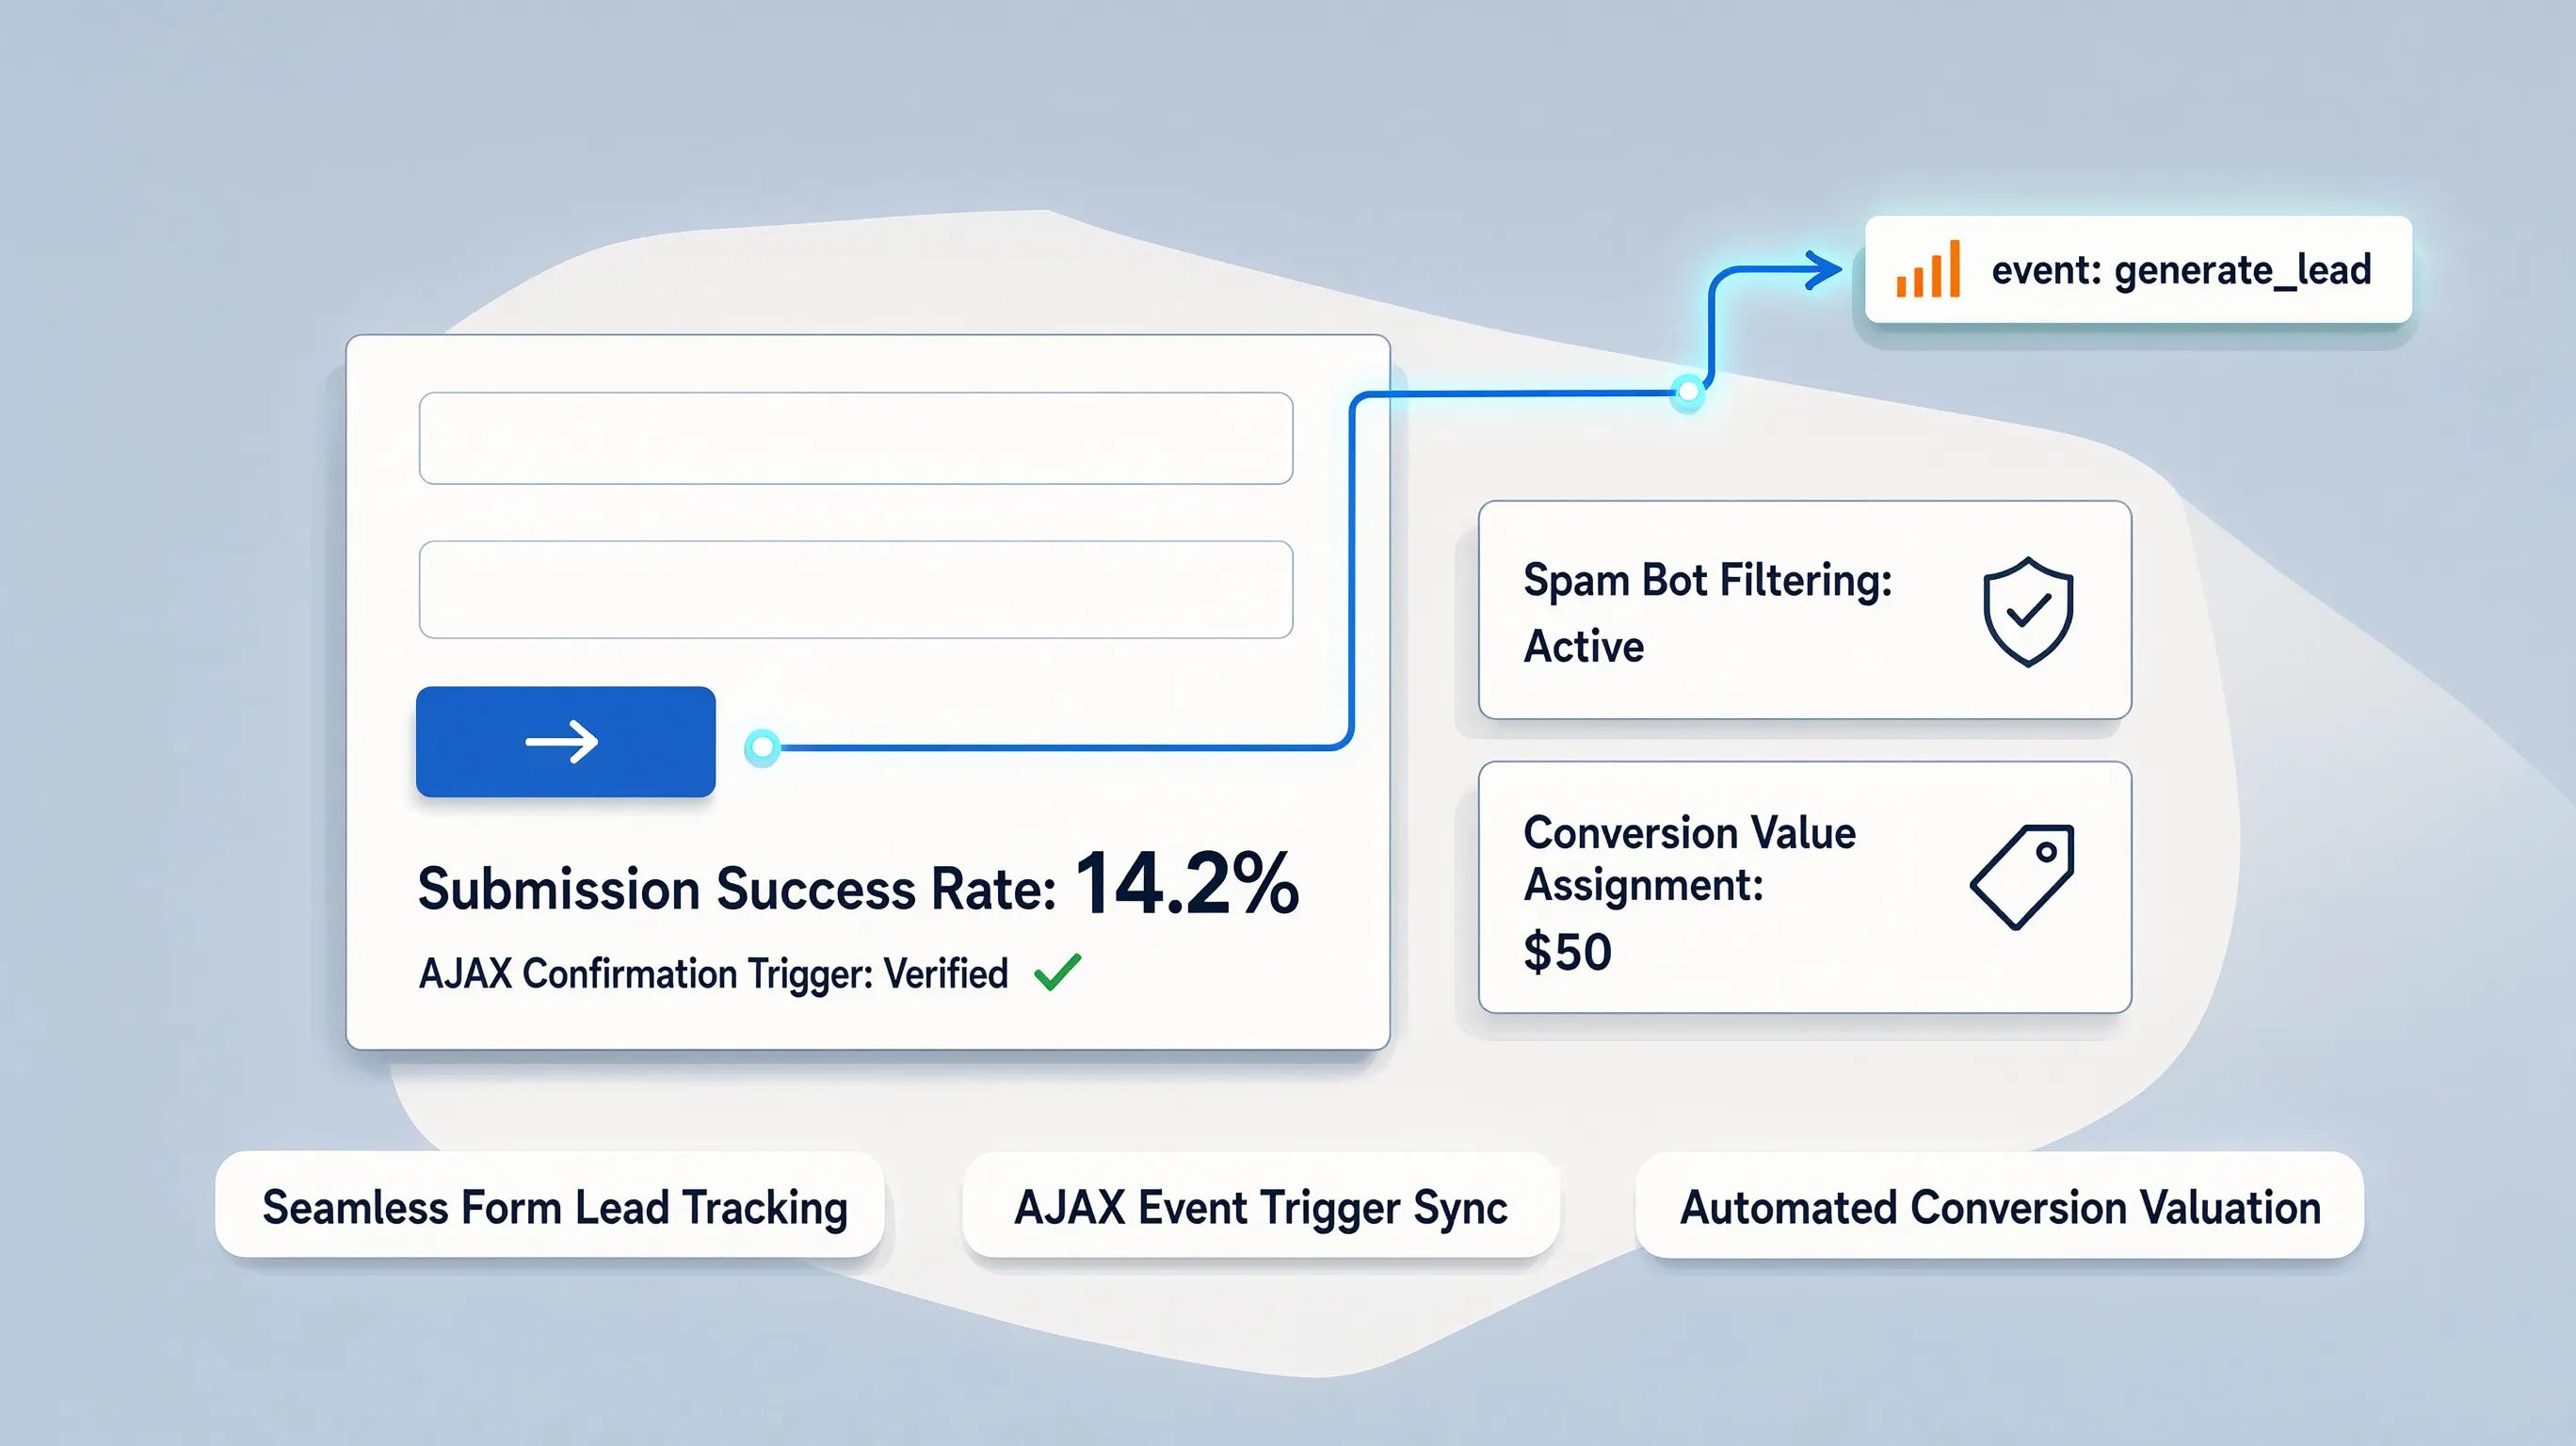
- Contact Form Completions: Track lead inquiries (see tracking contact form submissions in GA4).
- Click-to-Call Phone Inquiries: Capture direct mobile dials (see tracking phone call conversions from your website).
- E-Commerce Checkout Transactions: Track online sales revenue (see tracking website sales and revenue).
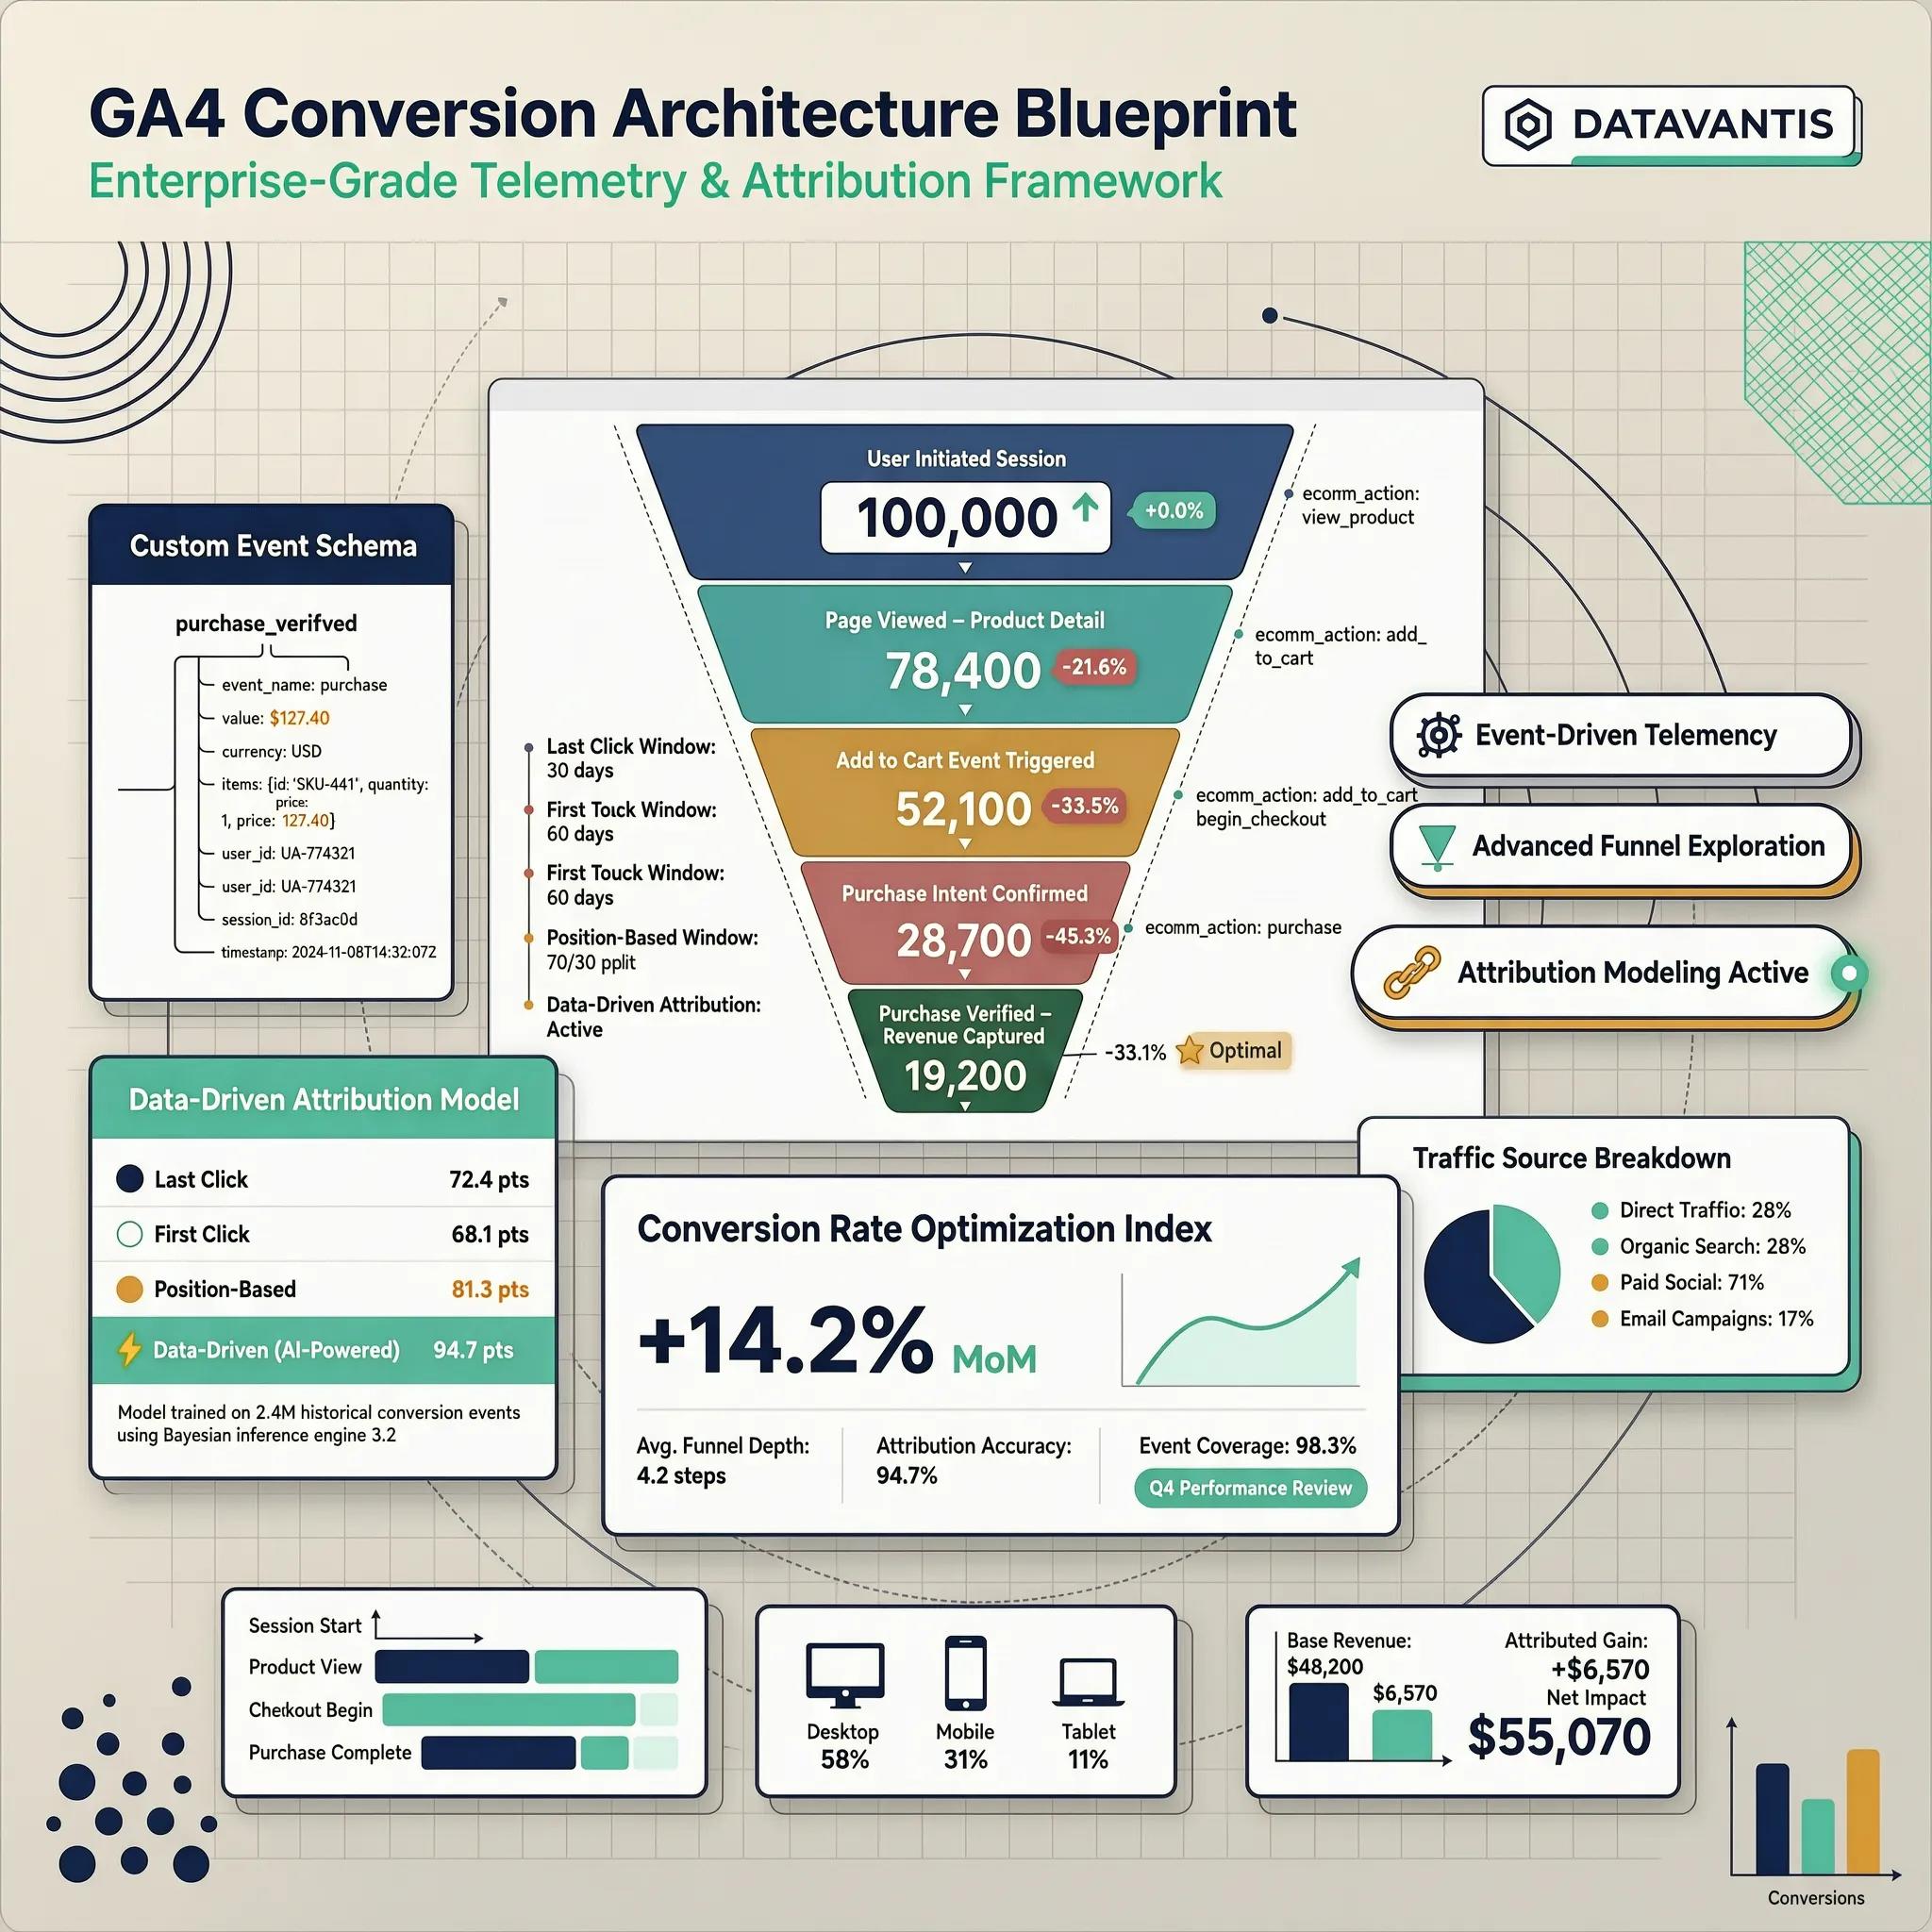
Running a thorough website traffic conversion analysis turns traffic to leads to elevate your website conversion analysis (deepen with our complete guide to tracking website conversions with GA4).
9. Spot Unusual Traffic Spikes, Drops, and Suspicious Visits
Sudden shifts in traffic reports can trigger immediate panic, but systematic diagnostics reveal the true root cause. Diagnose sudden metrics shifts using this checklist:
- Sudden Traffic Spikes: Check for referral spam, automated bot traffic, viral social media links, or recent email broadcasts.
- Sudden Traffic Drops: Verify tracking script installation, check for broken redirect rules, or review recent search engine algorithm updates.
Investigating a website traffic spike or a sudden drop in website traffic resolves unusual website traffic reports quickly (combine with diagnosing a sudden drop in website traffic).
10. Break Down Traffic by Device, Location, and Audience
Looking only at global site averages can hide severe technical issues that affect specific segments of your audience. Segment your traffic reports across key audience dimensions:
- Device Breakdown: Compare conversion rates between desktop and mobile users to catch mobile usability bugs.
- Geographic Breakdown: Verify that incoming visitors originate from regions where you actually provide services.
Auditing website traffic by device, evaluating website traffic by location, and executing audience traffic analysis keeps your site accessible for every user segment (also see how to make a website mobile-friendly).
11. Use GA4 and Search Console Together to Explain Traffic Changes
Comparing Google Analytics 4 and Google Search Console numbers often causes confusion because each platform measures a different stage of the user journey. Understand how these core tools work together:
- Google Search Console: Measures search engine visibility before a click occurs (impressions, search clicks, query rankings). Review the Google Search Console: Performance report for technical search performance.
- Google Analytics 4: Measures user behavior after arrival (sessions, engagement, form submissions). Review the Google Analytics: Reports and acquisition analysis documentation to cross-reference data.
Combining setups to analyze website traffic in GA4 alongside Google Search Console traffic builds a complete website analytics report (learn keywords in finding keywords in Google Search Console and pair with the Google Search Console guide for small businesses).
12. Turn Your Traffic Report Into a Practical Action Plan
Collecting analytics data is worthless if it doesn't lead to practical website improvements. Follow this 5-step monthly optimization routine:
- Spot the Trend: Identify your top-performing channels and underperforming landing pages.
- Form a Hypothesis: Pinpoint potential friction causes (such as poor copy, slow load speed, or weak CTA contrast).
- Deploy One Targeted Improvement: Update page headers, refine copy, or add authentic customer testimonials (see building trust on your business website).
- Measure Results: Allow 30 days of data collection to verify whether your changes improved engagement and key event rates.
Mastering how to analyze website traffic transforms standard website traffic analysis into a powerful website traffic report analysis framework on BoltWeb (combine with the core website metrics every small business should monitor).
Maximize Your Website Performance With BoltWeb
Analyzing visitor data, diagnosing drop-off bottlenecks, and setting up high-converting landing pages shouldn't feel like a frustrating technical chore. When you launch your online presence on BoltWeb, every element of your site is optimized for speed and conversion from day one.
Whether you run a local home service company, a professional consulting firm, or an online storefront, BoltWeb builds search-optimized section layouts, connects analytics tracking seamlessly, formats responsive mobile headers, and deploys lead-generating pages tailored to your target market.
Frequently Asked Questions: Identifying Your Traffic Sources
1. How do I find where my website traffic comes from so I know which marketing actually works?
Here is the plain truth: Guessing where your visitors originate is the fastest way to waste your marketing budget—spending thousands on social media ads while your actual paying clients arrive through organic search ruins your profitability. Learning to find where website traffic comes from gives you complete visibility into the entry paths driving real prospective customers to your storefront. Tracing your acquisition origins allows you to eliminate underperforming marketing channels and double down on the specific networks generating revenue. When you launch your online presence on BoltWeb, capturing visitor origins is seamlessly built-in right from the start. As an all-in-one business website builder, BoltWeb automatically connects channel tracking and structures conversion layouts in under 60 seconds! Auditing visitor acquisition parameters regularly ensures you invest time and budget exclusively into channels that move your business bottom line forward (start with the foundational Google Analytics setup walkthrough for small businesses).
2. What is the difference between a traffic channel, source, and medium in my acquisition reports?
Seeing technical labels like google / cpc or organic inside your reports often causes confusion when you just want to know how people found your site. Understand how digital analytics platforms organize visitor arrival paths: Default Channel Group: The broad operational category assigned to the visit (such as Organic Search, Direct, Referral, or Paid Social). Source: The exact platform or domain the user was visiting immediately before clicking over to your site (such as google, facebook, linkedin, or newsletter). Medium: The overarching distribution vehicle or commercial payment mechanism behind the visit (such as organic, cpc, referral, or email). Categorizing incoming visitors across these three clear dimensions prevents channel overlap and keeps your campaign tracking organized.
3. How can I tell how many people are finding my business through Google search for free?
Every business owner wants to know if their SEO efforts are paying off by bringing in unpaid searchers actively looking for their services. Track your organic search performance using two core diagnostic views: Google Analytics 4 Channel Reports: Filter your acquisition overview by Organic Search to review total session counts, engaged users, and on-site conversions. Google Search Console Diagnostic Data: Inspect the Google Search Console: Performance report to reveal the exact search phrases users typed before clicking your page link (see finding keywords in Google Search Console). Monitoring organic search traffic metrics helps you verify whether your content ranks for terms that attract high-intent leads rather than passive browsers (pair with tracking SEO conversions in Google Analytics).
4. Why does my analytics report say "Direct" traffic when I know people came from my campaigns?
Seeing a massive chunk of your audience categorized as "Direct" usually means tracking headers were stripped before the visitor landed on your page. Direct traffic occurs primarily under these four operational conditions: Manual Web Entry: The user typed your exact domain address into their address bar or opened a saved browser bookmark. Untagged Off-Site Links: The prospect clicked a link embedded inside a PDF document, desktop app, or private messaging thread (like WhatsApp). Missing Campaign Tags: The click originated from an email newsletter or social ad that lacked standard tracking parameters. Protocol Downgrades: The link redirected a visitor from a secure https:// domain to a non-secure http:// page. Applying standardized UTM tags to every external link you publish eliminates unassigned traffic gaps and keeps your direct reporting clean.
5. How do I see which external websites and directories are linking to me and sending visitors?
If you pay for directory listings, sponsor local events, or earn media mentions, you need to verify whether those backlinks drive actual website traffic. Reviewing incoming referral traffic reveals your top-performing external partners: Navigate to your GA4 acquisition panel and isolate the Referral channel grouping. Click into the Session source column to see the exact third-party domain names sending readers your way. Cross-reference referral sessions against key event completions to evaluate lead quality (see internal linking strategy for small business SEO). Isolating high-converting website referral sources helps you decide which directory subscriptions to renew and which link partnerships to drop.
6. Which social media platform is actually bringing prospective clients to my website?
Posting content across Facebook, Instagram, LinkedIn, and YouTube without tracking website visitors makes it impossible to know where your social strategy succeeds. Evaluate social network performance by measuring outcome value over vanity engagement: B2B Service Providers: Compare LinkedIn referral clicks against direct form submissions to measure professional inquiry rates. Local Consumer Businesses: Track visual click-throughs from Instagram bio links or Facebook posts to gauge local market interest. Paid vs. Organic Social: Isolate paid campaign traffic (cpc) from unpaid profile clicks (organic) to judge ad effectiveness. Tracking specific social traffic sources exposes which platforms warrant ongoing content creation and which ones just drain your team's time.
7. How do I track where website traffic comes from when running paid search or social ads?
When spending money on digital advertising, relying on raw click metrics from ad dashboards without cross-referencing on-site conversions leads to wasted budget. Set up rigorous paid campaign tracking using these best practices: Link your Google Ads account directly to GA4 to auto-tag incoming campaign parameters. Build custom landing pages dedicated exclusively to paid traffic streams (see landing page CTA best practices). Compare cost-per-click metrics against actual qualified lead completions in your analytics dashboard. Evaluating paid search traffic side-by-side with organic traffic channels protects your ad capital and increases overall marketing ROI (pair with our complete guide to tracking website conversions with GA4).
8. How do I track visitors who click links in my email newsletters or promotional blasts?
Sending out email broadcasts without custom campaign parameters causes analytics tools to lump those high-intent readers into generic "Direct" or "Unassigned" categories. Fix email acquisition tracking by tagging outbound links with UTM parameters: Add utm_source=email to identify the channel vehicle. Add utm_medium=newsletter or utm_medium=promo to specify the message type. Add utm_campaign=spring_sale to isolate the specific marketing push. Appending clean tracking strings to your email campaigns ensures every subscriber click is properly credited inside your email traffic reports.
9. Why does Google Analytics list some of my website visits as "Unassigned"?
Seeing a high percentage of "Unassigned" traffic in your reports indicates that incoming visitors carried incomplete or misformatted tracking parameters. Common causes behind unassigned traffic attribution: Non-Standard UTM Phrasing: Using custom tags like utm_medium=social_post that fail to match default channel rules. Broken Redirect Chains: Intermediary server redirects stripping campaign parameters before the landing page finishes loading. Late Tracking Execution: Analytics scripts firing after a visitor has already navigated away from the initial entry URL. Auditing your tracking URLs and verifying canonical redirect rules resolves unassigned traffic GA4 warnings quickly (also see how to fix redirect chains for SEO).
10. How do I find out which traffic sources bring in real phone calls, form leads, and sales?
Measuring raw visitor volume by channel is helpful, but finding which traffic sources convert into paying clients is what truly grows your business. Connect acquisition channels directly to business outcomes across these primary touchpoints: Contact Form Completions: Attribute form inquiries directly to entry sources (see tracking contact form submissions in GA4). Click-to-Call Phone Inquiries: Trace mobile phone dials back to specific acquisition channels (see tracking phone call conversions from your website). Online Store Checkout Sales: Measure gross e-commerce revenue generated by traffic origin (see tracking website sales and revenue). Mapping conversion events to entry channels identifies your most profitable marketing streams so you can allocate budget with certainty.
11. Where do I click in Google Analytics 4 to see a complete traffic acquisition report?
Finding your traffic origin data inside GA4 is straightforward once you know the exact menu paths to follow. Navigate to your primary acquisition reports using these steps: Open your GA4 property and click Reports in the left navigation sidebar. Expand the Acquisition menu folder and select Traffic acquisition. Click the dropdown arrow above the main table column to switch between Default channel group, Session source / medium, or Session source. Reviewing the official Google Analytics: Reports and acquisition analysis documentation helps you customize standard table views to highlight your primary revenue metrics.
12. How do I use traffic source data to make smart decisions about where to advertise?
Collecting traffic data is useless unless you translate those analytics insights into concrete operational changes that increase your revenues. Follow this straightforward monthly channel review routine: Identify Top Performers: Pinpoint the top 20% of acquisition channels generating 80% of your qualified leads. Flag Low-Converting Volume: Locate channels bringing high visitor counts but near-zero key event completions. Reallocate Budget & Effort: Shift ad dollars away from dead-end sources and reinvest into proven acquisition paths. Building high-converting landing pages tailored to your top traffic origins on BoltWeb ensures incoming visitors convert into lasting business revenue (combine with fixing high-traffic pages that fail to convert).